Unlock a world of possibilities! Login now and discover the exclusive benefits awaiting you.
- Qlik Community
- :
- Forums
- :
- Analytics
- :
- New to Qlik Analytics
- :
- Re: The actuals numbers of days between 2 dates
- Subscribe to RSS Feed
- Mark Topic as New
- Mark Topic as Read
- Float this Topic for Current User
- Bookmark
- Subscribe
- Mute
- Printer Friendly Page
- Mark as New
- Bookmark
- Subscribe
- Mute
- Subscribe to RSS Feed
- Permalink
- Report Inappropriate Content
The actuals numbers of days between 2 dates
Overall this is a part of a project utilisation application that shows utilisation at a region, role and worker level and can be reported weekly and monthly
Lets assume we are calculating weekly utilisation for 2 workers and we won't take into account role weighting and assume there are no holidays or any other time off.
Let's assume there are 22 days in the month excluding weekends and both worked full 7.5 hour days.
Target Hours = 22 days * 7.5 hours per day = 165 hours
Worker 1: worked every day in the month; 22 days * 7.5 hours per day = 165 hours
Utilisation: 165 hours worked / 165 target = 100%
Worker 2: worked from the 11th to 24th; 10 days * 7.5 hours per day = 75 hours
Utilisation: 75 hours worked / 165 target = 45.45%
The problem comes arises when the target hours for Worker 2 is calculated as 75 hours because they only have time records from 11th to the 24th but I need their target to be 165 hours.
These are the Variables I have...
vFirstSelectedPeriod = min([Period])
vLastSelectedPeriod = max([Period])
vWorkDaysInPeriod = NetWorkDays($(vFirstSelectedPeriod), $(vLastSelectedPeriod))
Please help. I'm very new to Qlik.
Neil
- « Previous Replies
-
- 1
- 2
- Next Replies »
Accepted Solutions
- Mark as New
- Bookmark
- Subscribe
- Mute
- Subscribe to RSS Feed
- Permalink
- Report Inappropriate Content
Hi Neil, with your tables I think you could use the following in a table per worker for example:
Numerator: NetWorkDays(Min(Period),Max(Period))
Denominator: NetWorkDays(Min(MonthStart(Period)),Max(MonthEnd(Period)))
- Mark as New
- Bookmark
- Subscribe
- Mute
- Subscribe to RSS Feed
- Permalink
- Report Inappropriate Content
Hi Neil, you may want to get the targets from another table?
- Mark as New
- Bookmark
- Subscribe
- Mute
- Subscribe to RSS Feed
- Permalink
- Report Inappropriate Content
Thanks Luis for you response.
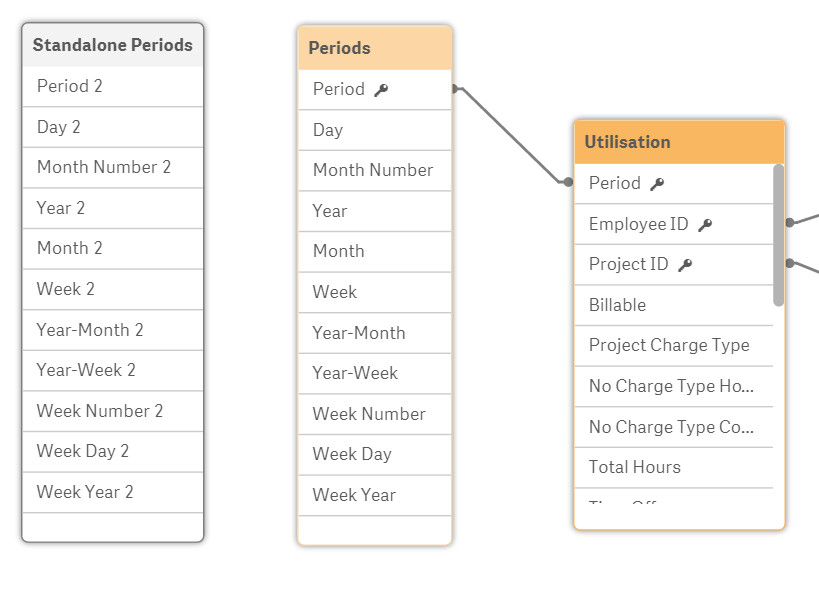
I've added a new separate table as suggested and attached below. I'm still a little unsure how I can link the 2 Period tables.
Users can select month/s, week/s or even a list of days from the data filter pane and I need all the data to be reflected based on their selection. However I also need to return the first and last date in that selected date range regardless of whether there is data for those period or not.
At the moment they select using the Periods table, so how can I use that selection to drive my variables to make sure they pick up the first and last period in the selected range.
vFirstSelectedPeriod = min([Period])
vLastSelectedPeriod = max([Period])
- Mark as New
- Bookmark
- Subscribe
- Mute
- Subscribe to RSS Feed
- Permalink
- Report Inappropriate Content
Can anyone suggest why any of these formulae will not work
I'm trying to return the first date when a user select a month, week or a list of days
min( {$} Period)
min( {$<Worker={"*"}>} Period)
min( {$<Region={"*"}>} Period)
- Mark as New
- Bookmark
- Subscribe
- Mute
- Subscribe to RSS Feed
- Permalink
- Report Inappropriate Content
Hi Neil, I'm taking it back, you may not need another table. I'll work on it for a bit and will let you know. The numerator of your kpi needs the difference of the days as you already have but the denominator needs the difference between the day 1 of the month of the time frame selected and the last day of the month of the time frame selected, which I think could be done with set analysis. Because your targets are full months right?
- Mark as New
- Bookmark
- Subscribe
- Mute
- Subscribe to RSS Feed
- Permalink
- Report Inappropriate Content
yes and no.
yes the numerator is correct and is the number of hours logged by each worker in the selected period. The denominator is the number of hours (or days * 7.5) that result from the user selecting a month, a week or a range of days. So, to answer your second question, no the number of days could be made up of the entire month or a week in the middle of the month or even the previous 3 days.
Really appreciate you taking the time to look at this issue. I have only been using Qlik for a few weeks and loving it so far.
- Mark as New
- Bookmark
- Subscribe
- Mute
- Subscribe to RSS Feed
- Permalink
- Report Inappropriate Content
Hi Neil, with your tables I think you could use the following in a table per worker for example:
Numerator: NetWorkDays(Min(Period),Max(Period))
Denominator: NetWorkDays(Min(MonthStart(Period)),Max(MonthEnd(Period)))
- Mark as New
- Bookmark
- Subscribe
- Mute
- Subscribe to RSS Feed
- Permalink
- Report Inappropriate Content
Hey I think you may have solved my issue. You are a legend.
I had to tweak the calc ever so slightly so it takes into account a user selecting a period or a week or a month
if(GetCurrentSelections() like '*Period:*',NetWorkDays(Min(Period),Max(Period)),
if(GetCurrentSelections() like '*Week:*',NetWorkDays(Min(WeekStart(Period)),Max(WeekEnd(Period))),
if(GetCurrentSelections() like '*Year-Month:*',NetWorkDays(Min(MonthStart(Period)),Max(MonthEnd(Period))),
NetWorkDays(makedate(2017,07,31),Today(0)),)))
I added the last line so it also works if no selection is made. My data goes back to 31-July.
One more question. is there a way I can default the period selection when the user first opens the sheet?
- Mark as New
- Bookmark
- Subscribe
- Mute
- Subscribe to RSS Feed
- Permalink
- Report Inappropriate Content
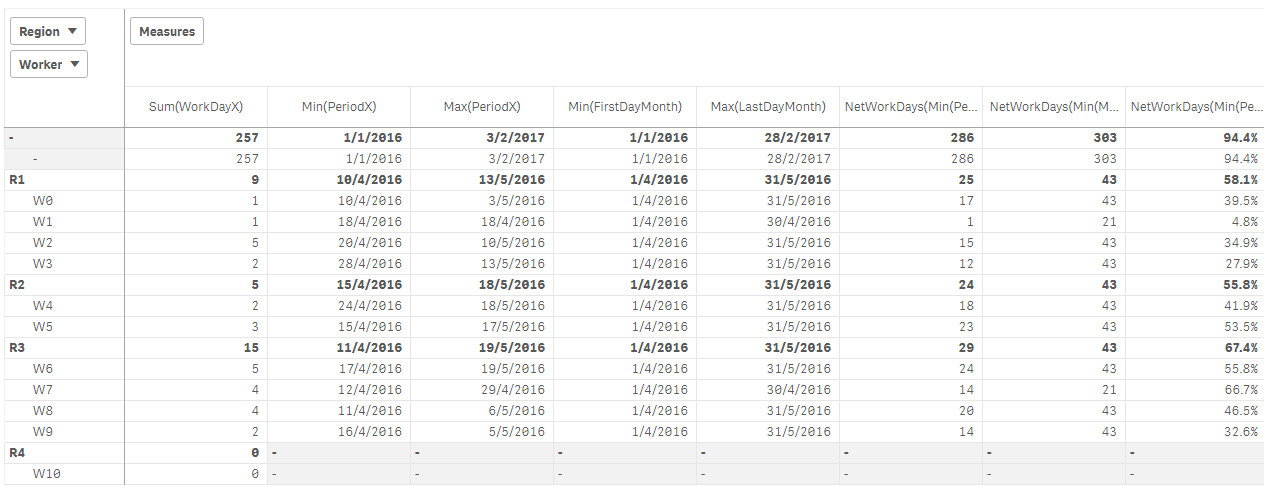
Now that I have the correct number of days showing up based on the user selection, I need it to aggregate up my hierarchy as follows:
Region
Role
Worker
But all the days are showing as 21 even at the Region and Role level.
How do I get the Role value to be a sum of all the Workers values so that I have
10 Workers under a Role x 21 work days = 210 work days at the Role level
I tried enclosing my calc (show above) in an AGGR and a SUM function with no success
- Mark as New
- Bookmark
- Subscribe
- Mute
- Subscribe to RSS Feed
- Permalink
- Report Inappropriate Content
Hi Neil,
I think you need to define the roll-up calculations (regions and roles). Maybe it'll be worth opening a new discussion with a simplification of what you have and what you're trying to achieve. Showing some sample data and the outcome you'd expect.
I tried rolling up to regions without changing anything and numbers seem fine to me but of course I don't know what's expected
I hope this helps,
Cheers,
Luis
- « Previous Replies
-
- 1
- 2
- Next Replies »