Unlock a world of possibilities! Login now and discover the exclusive benefits awaiting you.
- Qlik Community
- :
- Forums
- :
- Analytics
- :
- New to Qlik Analytics
- :
- Re: Ignore Dimension-Filter for If Statement in Pi...
- Subscribe to RSS Feed
- Mark Topic as New
- Mark Topic as Read
- Float this Topic for Current User
- Bookmark
- Subscribe
- Mute
- Printer Friendly Page
- Mark as New
- Bookmark
- Subscribe
- Mute
- Subscribe to RSS Feed
- Permalink
- Report Inappropriate Content
Ignore Dimension-Filter for If Statement in Pivot Table
Hey there,
I have an really frustrating problem and hope you might be able to help me.
The following example does not make much sense, but is a downsized / abstract version of my problem.
Table:
load * inline
[Dimension1,Dimension2, Value
A,XX,1
B,YY,2
C,ZZ,3];
Now I create a new sheet with
- Pivot-Table
- Row: Dimension1
- Colum: Dimension2
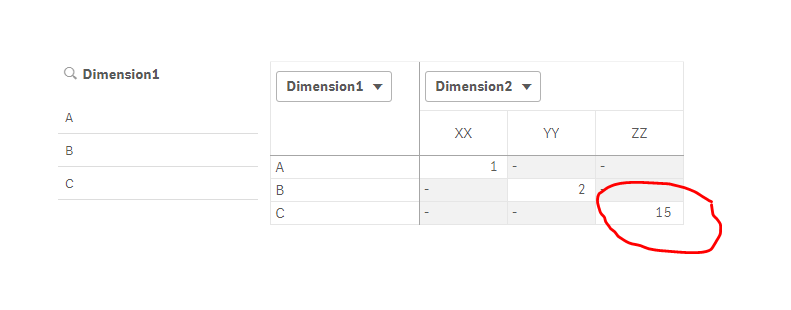
- Expression: if(Dimension2 = 'ZZ', 15, Sum({1}Value))
- Filter
- Dimension1
This works great if there is no filter set.
But is not working anymore as soon as i use a filter.
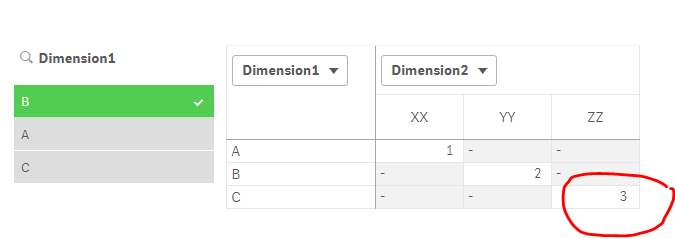
I want to have that table completely independent from any filters that are used.
Do you have any idea of how to achieve this?
Thanks very much for your help!
- « Previous Replies
- Next Replies »
Accepted Solutions
- Mark as New
- Bookmark
- Subscribe
- Mute
- Subscribe to RSS Feed
- Permalink
- Report Inappropriate Content
- Mark as New
- Bookmark
- Subscribe
- Mute
- Subscribe to RSS Feed
- Permalink
- Report Inappropriate Content
Maybe this
if(Only({1}Dimension2) = 'ZZ', 15, Sum({1}Value))
- Mark as New
- Bookmark
- Subscribe
- Mute
- Subscribe to RSS Feed
- Permalink
- Report Inappropriate Content
maybe this:
=Sum( {1} if(Dimension2 = 'ZZ', 15, Value) )
- Mark as New
- Bookmark
- Subscribe
- Mute
- Subscribe to RSS Feed
- Permalink
- Report Inappropriate Content
Hey thanks for your help,
unfortunately this solution has a weird problem: When you set a filter and do a reload, the values in the table change / update.
- Mark as New
- Bookmark
- Subscribe
- Mute
- Subscribe to RSS Feed
- Permalink
- Report Inappropriate Content
Hey,
this works great for the pivot table! Thanks very much!
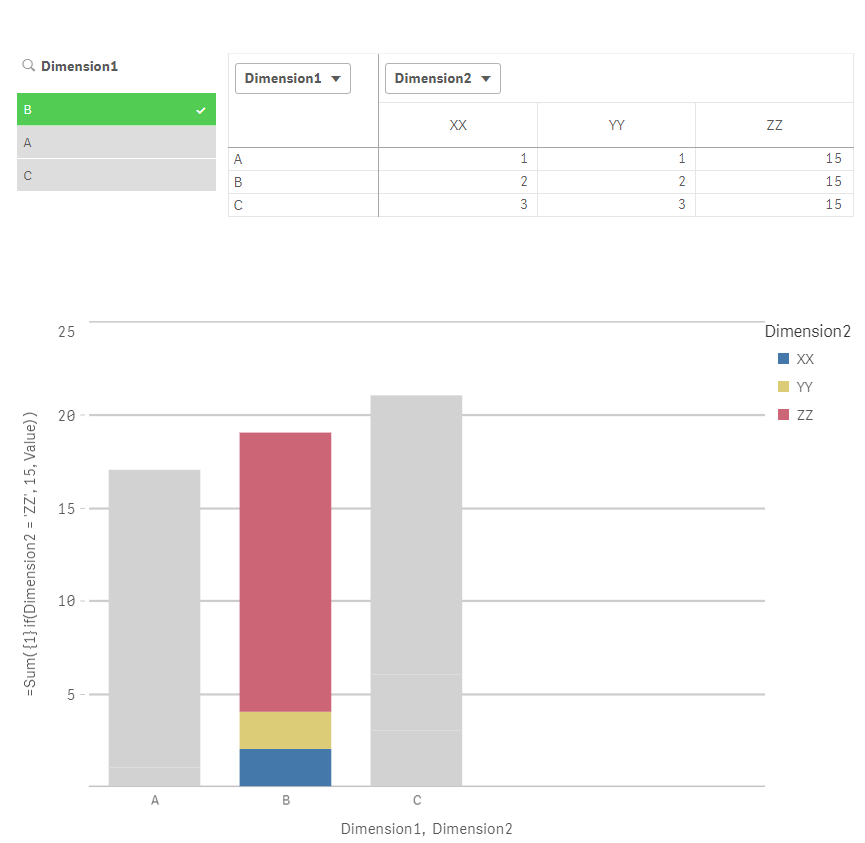
Unfortunately I need to present this data in a barchart too and your formular does not work as intended, because it just greys out the bars. 😕
Do you have any idea of how to show the full barchart?
- Mark as New
- Bookmark
- Subscribe
- Mute
- Subscribe to RSS Feed
- Permalink
- Report Inappropriate Content
That should not have to do anything with the proposed solution. Have you tried to compare the two expressions after reloads? they give different outputs?
if(Dimension2 = 'ZZ', 15, Sum({1}Value))
if(Only({1}Dimension2) = 'ZZ', 15, Sum({1}Value))
- Mark as New
- Bookmark
- Subscribe
- Mute
- Subscribe to RSS Feed
- Permalink
- Report Inappropriate Content
you are right it should not, but it does. I reported it to Qlik already. You can try it out by yourself if you want to. (tested on September 2017 Release)
Load Script
Data:
load * inline
[Dimension1, Value
A,1
B,2
C,3];
Extra_Dimension:
load * inline
[Dimension2
XX
YY
ZZ
];
Reproduction
1) Load Data
2) Create new Sheet
3) Insert Pivot Table
a. Dimension Row: Dimension1
b. Dimension Column: Dimension2
c. Measure: if(Only({1}Dimension2) = 'ZZ', 15, Sum({1}Value))
4) Inset Filter for Dimension1
5) Select B in Dimension1 filter panel
6) Open Data Editor and click Reload
PROBLEM: Values have changed!
- Mark as New
- Bookmark
- Subscribe
- Mute
- Subscribe to RSS Feed
- Permalink
- Report Inappropriate Content
1) Is your data model this?
Table:
load * inline
[Dimension1,Dimension2, Value
A,XX,1
B,YY,2
C,ZZ,3];
or this
Data:
load * inline
[Dimension1, Value
A,1
B,2
C,3];
Extra_Dimension:
load * inline
[Dimension2
XX
YY
ZZ
];
I assume that it is the 1st one based on the looks of the chart....
I tried it and values are not changing for me... sample attached
- Mark as New
- Bookmark
- Subscribe
- Mute
- Subscribe to RSS Feed
- Permalink
- Report Inappropriate Content
The first one is the test data model.
The second one comes much closer to my real problem. And the second one definetely produces the described issue.
The good thing is, that Andreas Formular is working for my pivot table. Even it does not work for my barchart.
- Mark as New
- Bookmark
- Subscribe
- Mute
- Subscribe to RSS Feed
- Permalink
- Report Inappropriate Content
I guess it is good that one of the option is working, but even with the data model change, I am seeing the numbers change... I mean what exactly do you see changing? Dimension1 = B becomes 4, 4, 30 from 2, 2, 15? or what?
- « Previous Replies
- Next Replies »