Unlock a world of possibilities! Login now and discover the exclusive benefits awaiting you.
- Qlik Community
- :
- Forums
- :
- Analytics
- :
- New to Qlik Analytics
- :
- Re: HELP: Compare the count of data in columns // ...
- Subscribe to RSS Feed
- Mark Topic as New
- Mark Topic as Read
- Float this Topic for Current User
- Bookmark
- Subscribe
- Mute
- Printer Friendly Page
- Mark as New
- Bookmark
- Subscribe
- Mute
- Subscribe to RSS Feed
- Permalink
- Report Inappropriate Content
HELP: Compare the count of data in columns // AIUTO: confrontare il conteggio di dati in colonne
Hello! I'm new with Qlik and I need help to do a thing // Buongiorno a tutti. Sono nuovo su Qlik ed avrei bisogno di un consiglio.
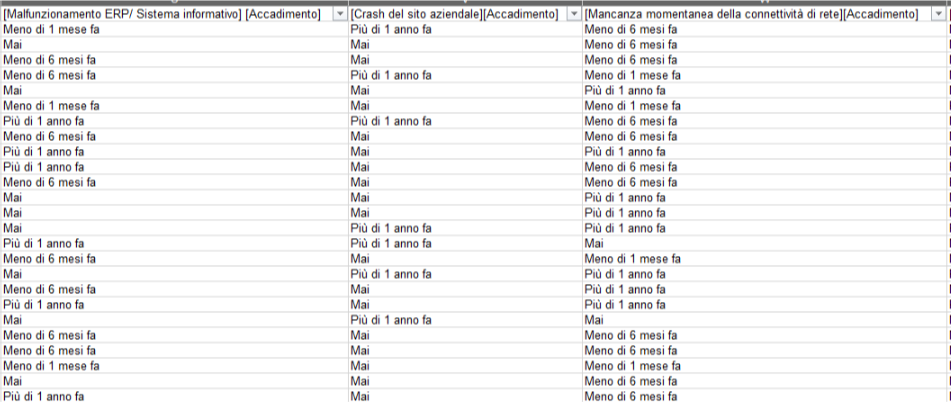
I have the following table // Ho una situazione del genere in tabella:
| [Malfunzionamento ERP/ Sistema informativo] [Accadimento] | [Crash del sito aziendale][Accadimento] | [Mancanza momentanea della connettività di rete][Accadimento] |
| Meno di 1 mese fa | Più di 1 anno fa | Meno di 6 mesi fa |
| Mai | Mai | Meno di 6 mesi fa |
| Meno di 6 mesi fa | Mai | Meno di 6 mesi fa |
| Meno di 6 mesi fa | Più di 1 anno fa | Meno di 1 mese fa |
| Mai | Mai | Più di 1 anno fa |
| Meno di 1 mese fa | Mai | Meno di 1 mese fa |
| Più di 1 anno fa | Più di 1 anno fa | Meno di 6 mesi fa |
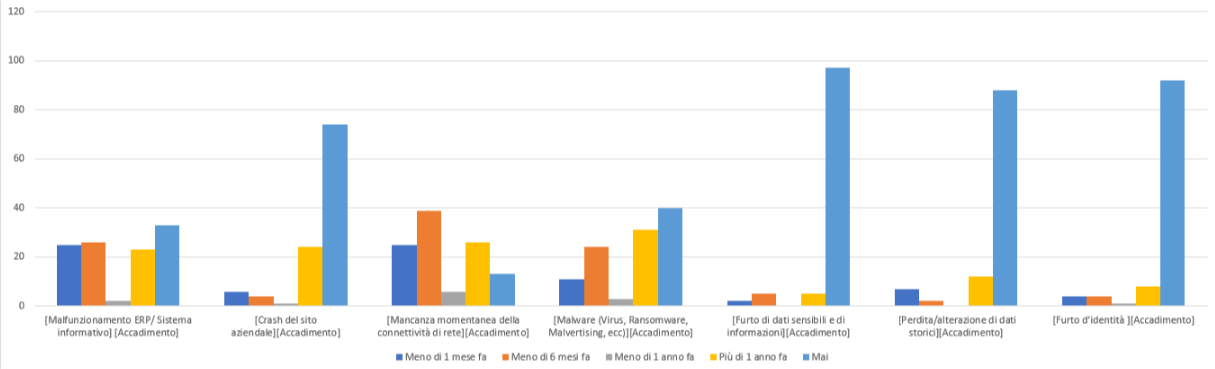
I would like to insert in Qlik a bar graph that highlights to me, for each column, the number of equal answers. I'd like it to first put close the count of all the answers in the first column (e. g. 10 Mai, 15 Meno di un mese, 12 Meno di 6 mesi), then those in the second column and so
Vorrei inserire in Qlik un grafico a barre che mi evidenzi, per ciascuna colonna, il numero di risposte uguali, ovvero che prima mi mettesse vicino il conteggio di tutte le risposte della prima colonna (es. 10 Mai, 15 Meno di un mese, 12 Meno di 6 mesi), poi quelle della seconda colonna e così via.
Is this possible in Qlik? For now I have only managed it with Excel Pivots... Thank you in advance to those who want to help me!
È possibile in Qlik? Per ora ci sono riuscito solo con le Pivot di Excel.. Grazie in anticipo a chi vorrà aiutarmi!
- Mark as New
- Bookmark
- Subscribe
- Mute
- Subscribe to RSS Feed
- Permalink
- Report Inappropriate Content
Hi Salvatore,
Just create a List box with the field and set the option "Show Frequency" like below:
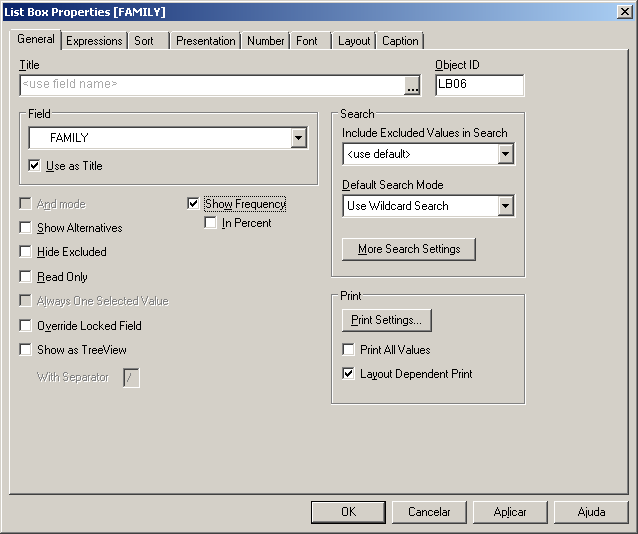
OEM Solution Architect
LATAM
- Mark as New
- Bookmark
- Subscribe
- Mute
- Subscribe to RSS Feed
- Permalink
- Report Inappropriate Content
could you provide a sample excel data file with your data and your expected result ?
- Mark as New
- Bookmark
- Subscribe
- Mute
- Subscribe to RSS Feed
- Permalink
- Report Inappropriate Content
I'm using Qlik Sense Desktop, is this function available? I can't find it
Thanks for your answer
- Mark as New
- Bookmark
- Subscribe
- Mute
- Subscribe to RSS Feed
- Permalink
- Report Inappropriate Content
This is part of the table i have
This is the result i need
Thanks for your answer!
- Mark as New
- Bookmark
- Subscribe
- Mute
- Subscribe to RSS Feed
- Permalink
- Report Inappropriate Content
Dear Salvatore,
You will need to use Count or Set Analysis for each specific date like this expression:
Count(TOTAL <Malfunzionamento ...=1> Malfunzionamento ...)
Count(TOTAL <Malfunzionamento ...=2> Malfunzionamento ...)
Take a look on these two articles to help you:
Count - chart function ‒ Qlik Sense
OEM Solution Architect
LATAM