Unlock a world of possibilities! Login now and discover the exclusive benefits awaiting you.
- Qlik Community
- :
- All Forums
- :
- QlikView App Dev
- :
- Re: Dynamic Button to Select Top n Values
- Subscribe to RSS Feed
- Mark Topic as New
- Mark Topic as Read
- Float this Topic for Current User
- Bookmark
- Subscribe
- Mute
- Printer Friendly Page
- Mark as New
- Bookmark
- Subscribe
- Mute
- Subscribe to RSS Feed
- Permalink
- Report Inappropriate Content
Dynamic Button to Select Top n Values
Hi,
I want to have a button that when pressed selects the top n values of a field but I also would really like a user to be able to input how many values and which of the fields (Cost, Revenue, Margin) it selects over.
In the button options I have tried 'Select in Field' but don't know what to put for the Search String. I also don't know how to incorporate inputs into a buttons functionality.
Any help would be much appreciated!
- « Previous Replies
-
- 1
- 2
- Next Replies »
- Mark as New
- Bookmark
- Subscribe
- Mute
- Subscribe to RSS Feed
- Permalink
- Report Inappropriate Content
Can't you just use a straight table, you can set how many rows are seen by changing "max number" in the presentation tab, you can use a variable to set that.
- Mark as New
- Bookmark
- Subscribe
- Mute
- Subscribe to RSS Feed
- Permalink
- Report Inappropriate Content
If the above doesn't help you can try something like this
="=rank(aggr(sum(Sales),Customer))<=" & variableN
- Mark as New
- Bookmark
- Subscribe
- Mute
- Subscribe to RSS Feed
- Permalink
- Report Inappropriate Content
I could have a separate table where users could select the contents but I'd rather have a shiny button on each page of graphs that selects the best and worst. I tried =rank(aggr(sum(Cost), Customer))<=10 in the search string but it doesn't seem to do anything.
- Mark as New
- Bookmark
- Subscribe
- Mute
- Subscribe to RSS Feed
- Permalink
- Report Inappropriate Content
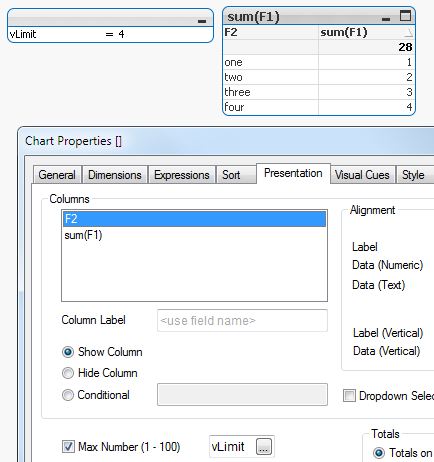
You could use Input Field to set a variable (vLimit in my example).
Use that variable in the Presentation->Max Number setting of your chart.
- Mark as New
- Bookmark
- Subscribe
- Mute
- Subscribe to RSS Feed
- Permalink
- Report Inappropriate Content
hei
attach is an example
maybe it can help you
what the user will have to do is select the measure for filter
number of top Customers
and the table will filter
- Mark as New
- Bookmark
- Subscribe
- Mute
- Subscribe to RSS Feed
- Permalink
- Report Inappropriate Content
I only have personal edition so can't open other people's files. Is it possible for you to explain what you've done with some code?
Thanks!
- Mark as New
- Bookmark
- Subscribe
- Mute
- Subscribe to RSS Feed
- Permalink
- Report Inappropriate Content
CustomerName,
Sales,
Cost,
Profit
FROM
(
LOAD * INLINE [
Meas
sum(Sales)
sum(Cost)
sum(Profit)
];
- Mark as New
- Bookmark
- Subscribe
- Mute
- Subscribe to RSS Feed
- Permalink
- Report Inappropriate Content
hello ,
Take i inline like below
Load * Inline [
ColName
Top1
Top2
Top3
:
:
:
:
Top N
];
in chart u want n max
go to presentation and in max number shown option write code below
If(ColName='Top1',1,if(ColName='Top2',2,...........))
hope it will work for you
thanks
Sunil Chauhan
- Mark as New
- Bookmark
- Subscribe
- Mute
- Subscribe to RSS Feed
- Permalink
- Report Inappropriate Content
You can use a Slider control to let the user select a value into a variable. Then in the Presentation tab, in the Max visible number, reference the variable used in the Slider control.
- « Previous Replies
-
- 1
- 2
- Next Replies »