Unlock a world of possibilities! Login now and discover the exclusive benefits awaiting you.
- Qlik Community
- :
- All Forums
- :
- QlikView App Dev
- :
- How to create a dynamic reference line in a bar ch...
- Subscribe to RSS Feed
- Mark Topic as New
- Mark Topic as Read
- Float this Topic for Current User
- Bookmark
- Subscribe
- Mute
- Printer Friendly Page
- Mark as New
- Bookmark
- Subscribe
- Mute
- Subscribe to RSS Feed
- Permalink
- Report Inappropriate Content
How to create a dynamic reference line in a bar chart
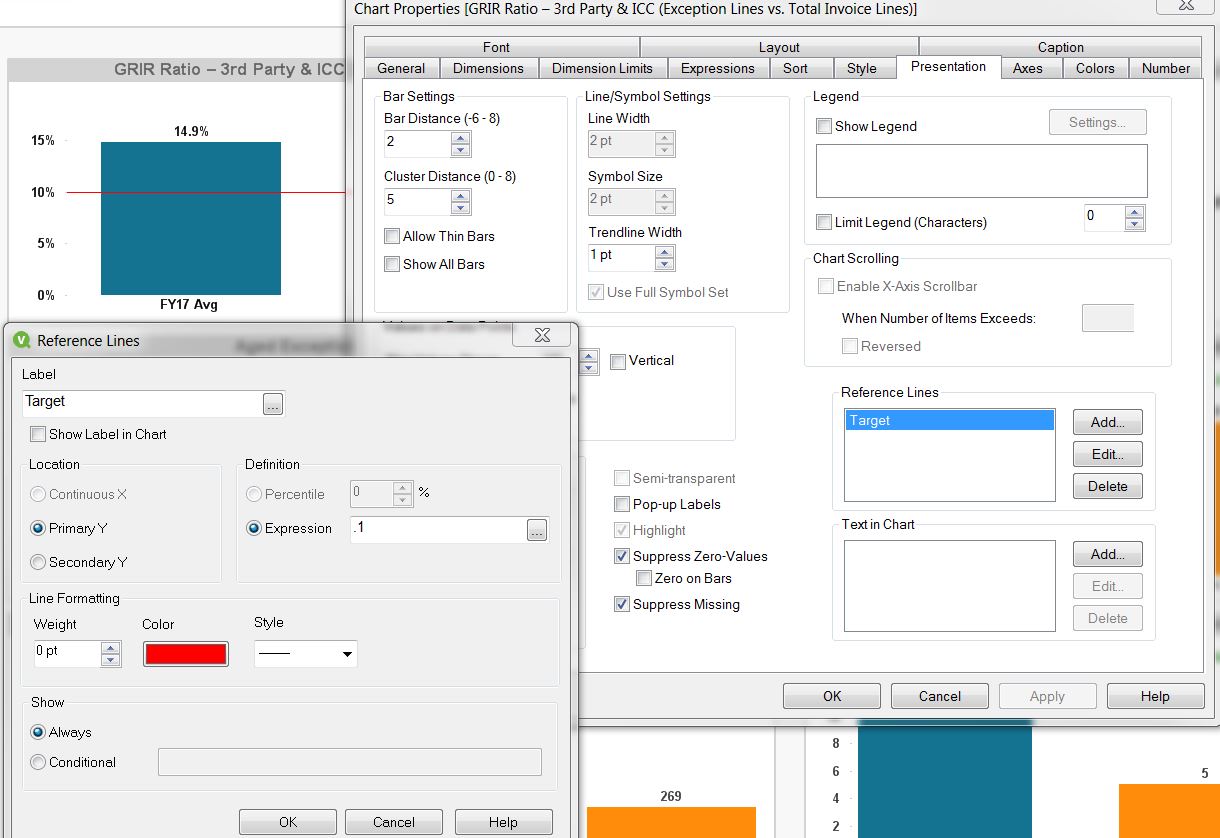
I have a bar chart with a specific reference line. The reference line represents a target or a goal of 10%. However, when the bar chart values go below 10%, I lose the reference line. How can I make the reference line be dynamic and still display when the values dip below the reference line value?
- « Previous Replies
-
- 1
- 2
- Next Replies »
- Mark as New
- Bookmark
- Subscribe
- Mute
- Subscribe to RSS Feed
- Permalink
- Report Inappropriate Content
No ones knows how to answer this question?
- Mark as New
- Bookmark
- Subscribe
- Mute
- Subscribe to RSS Feed
- Permalink
- Report Inappropriate Content
Can you share a sample to look into? What is the expr you are using for your reference line. May be use Axis tab for static min and static max to enter min and max values. Not sure unless i see some information.
- Mark as New
- Bookmark
- Subscribe
- Mute
- Subscribe to RSS Feed
- Permalink
- Report Inappropriate Content
Cliff,
Can you please share a screenshot of the reference line expression you're using?
- Mark as New
- Bookmark
- Subscribe
- Mute
- Subscribe to RSS Feed
- Permalink
- Report Inappropriate Content
- Mark as New
- Bookmark
- Subscribe
- Mute
- Subscribe to RSS Feed
- Permalink
- Report Inappropriate Content
Can you share a sample file?
- Mark as New
- Bookmark
- Subscribe
- Mute
- Subscribe to RSS Feed
- Permalink
- Report Inappropriate Content
No, the file is quite large and has proprietary information in it.
- Mark as New
- Bookmark
- Subscribe
- Mute
- Subscribe to RSS Feed
- Permalink
- Report Inappropriate Content
You'll need to set the max axis value on the Axes tab.
I don't know your dimension or expression but it would be something like this.
=rangemax(0.10,max(aggr(ChartExpression,ChartDimension))+0.05)
- Mark as New
- Bookmark
- Subscribe
- Mute
- Subscribe to RSS Feed
- Permalink
- Report Inappropriate Content
What is your expression you are using for your bar chart? As Atkinson mentioned you have to write an expr in Axes tab.
- Mark as New
- Bookmark
- Subscribe
- Mute
- Subscribe to RSS Feed
- Permalink
- Report Inappropriate Content
My chart doesn't have a dimension and it has 13 different expressions.
- « Previous Replies
-
- 1
- 2
- Next Replies »