Unlock a world of possibilities! Login now and discover the exclusive benefits awaiting you.
- Qlik Community
- :
- Forums
- :
- Analytics
- :
- New to Qlik Analytics
- :
- Re: Full accumulation - showing a period
- Subscribe to RSS Feed
- Mark Topic as New
- Mark Topic as Read
- Float this Topic for Current User
- Bookmark
- Subscribe
- Mute
- Printer Friendly Page
- Mark as New
- Bookmark
- Subscribe
- Mute
- Subscribe to RSS Feed
- Permalink
- Report Inappropriate Content
Full accumulation - showing a period
Hi guys,
I'm facing a problem in my line chart.
I want to show the accumulated sum of a bank balance, but only for this year.
To do so, I'm using the following script with MonthYear as dimension:
rangesum(above(sum([GL Amount USD]),0,rowno()))
This script is working fine when I'm showing the bank balance as a line chart over all the years in our database.
When I'm selecting to show only the current year, the script above is starting to accumulate with the first month of the current year as starting point.
How could I make a chart where the bank balance is fully accumulated over all the years, but where only the current year is displayed?
Thanks a lot in advance!:)
Cheers,
Mike
- Mark as New
- Bookmark
- Subscribe
- Mute
- Subscribe to RSS Feed
- Permalink
- Report Inappropriate Content
Try this
Dimension
Month
Year
Expression
Only({<Year = {2017, 2016}>} Aggr(RangeSum(Above(Sum({<Year, Date, MonthYear, Month>}[GL Amount USD]), 0, RowNo())), Year, Month))
- Mark as New
- Bookmark
- Subscribe
- Mute
- Subscribe to RSS Feed
- Permalink
- Report Inappropriate Content
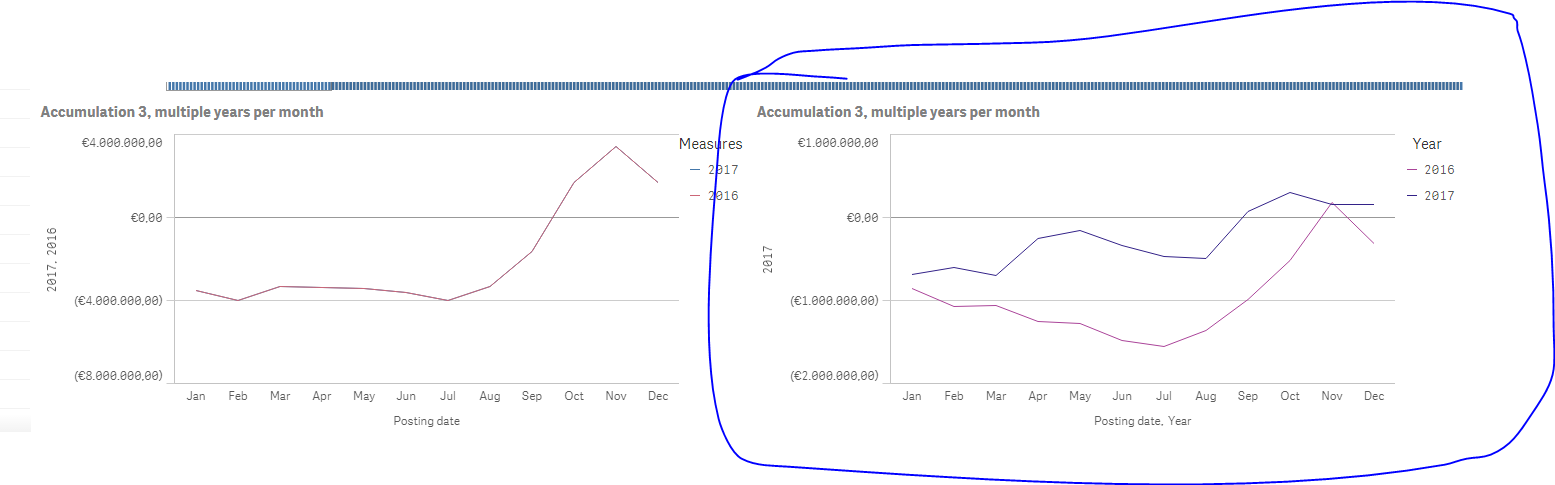
Still not fully solved.. There are two lines in the chart now (as supposed to be), but as you can see in table next to or the chart 'accumulated 2, current year' above the chart, the values are not correct.
In example, January 2017 should've 1.355.380,49 as value, but now shows -708.742,09.
Unfortunately, I can't explain why Qlik is showing these numbers..
- Mark as New
- Bookmark
- Subscribe
- Mute
- Subscribe to RSS Feed
- Permalink
- Report Inappropriate Content
That was completely my bad... try this
Only({<Year = {2017, 2016}>} Aggr(RangeSum(Above(TOTAL Sum({<Year, Date, MonthYear, Month>}[GL Amount USD]), 0, RowNo(TOTAL))), Year, Month))
- Mark as New
- Bookmark
- Subscribe
- Mute
- Subscribe to RSS Feed
- Permalink
- Report Inappropriate Content
We're getting close, but the numbers of the fourth and the second chart still doesn't match..
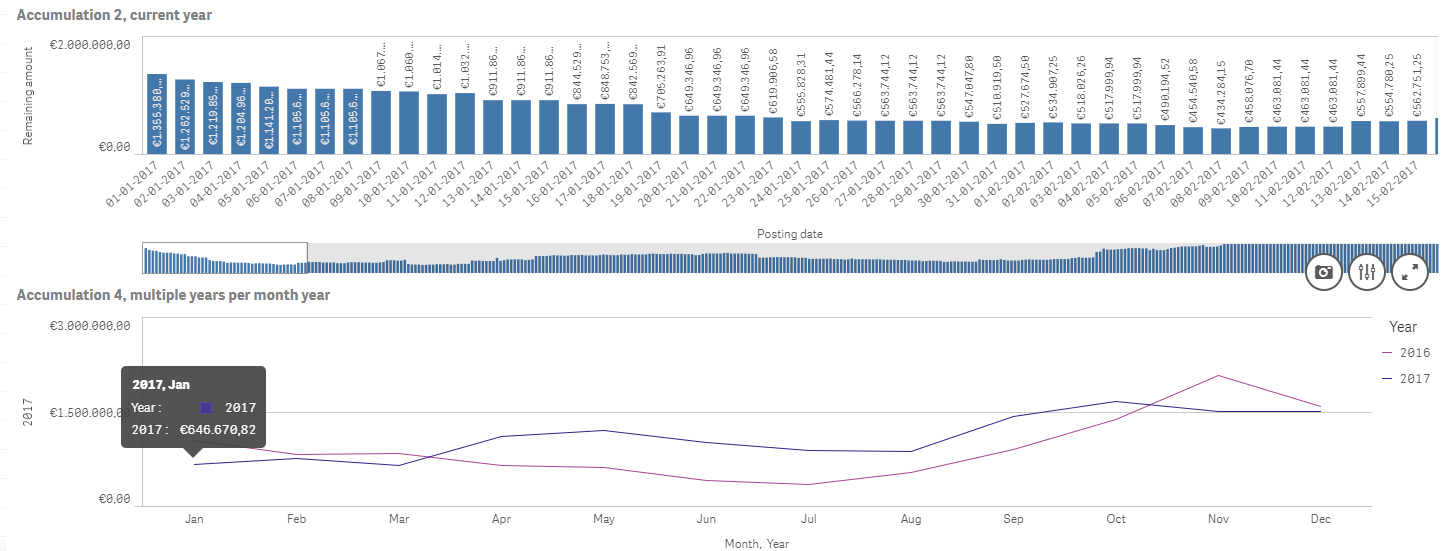
The number in the box of Jan 2017, doesn't exist in the chart above. Is this number the average amount of January? And is it possible to change this number to the value on the last day of the month?
- Mark as New
- Bookmark
- Subscribe
- Mute
- Subscribe to RSS Feed
- Permalink
- Report Inappropriate Content
Seems like a sorting issue 
Only({<Year = {2017, 2016}>} Aggr(RangeSum(Above(TOTAL Sum({<Year, Date, MonthYear, Month>}[GL Amount USD]), 0, RowNo(TOTAL))), Year, (Month, (NUMERIC))))
- Mark as New
- Bookmark
- Subscribe
- Mute
- Subscribe to RSS Feed
- Permalink
- Report Inappropriate Content
Wow Sunny, you're a god! This is going to help me very much and I'm really thankful for your help
Hopefully other Qlik users are also helped with your solution.
- Mark as New
- Bookmark
- Subscribe
- Mute
- Subscribe to RSS Feed
- Permalink
- Report Inappropriate Content
stalwar1 : MVP.
- Mark as New
- Bookmark
- Subscribe
- Mute
- Subscribe to RSS Feed
- Permalink
- Report Inappropriate Content
Hahahaha, I am not god my friend... I am just a regular human being....
You also wanted to "change this number to the value on the last day of the month"? is this still needed or are we done?
- Mark as New
- Bookmark
- Subscribe
- Mute
- Subscribe to RSS Feed
- Permalink
- Report Inappropriate Content
Hahaha for this moment you are for me!:)
The value that's shown now, is the value at the end of the month, so that's good for me.
Nevertheless, it could be interesting and worthy to know how change this to another point in the month (i.e. the begin).
But then this conversation is starting to look like a lecture, so up to you if you find that any interesting to figure out!
- Mark as New
- Bookmark
- Subscribe
- Mute
- Subscribe to RSS Feed
- Permalink
- Report Inappropriate Content
Do you think if we move the chart down by a single month, that will give you what you are looking to get?