Unlock a world of possibilities! Login now and discover the exclusive benefits awaiting you.
- Qlik Community
- :
- All Forums
- :
- QlikView App Dev
- :
- Re: Line chart Multiple expressions and One line
- Subscribe to RSS Feed
- Mark Topic as New
- Mark Topic as Read
- Float this Topic for Current User
- Bookmark
- Subscribe
- Mute
- Printer Friendly Page
- Mark as New
- Bookmark
- Subscribe
- Mute
- Subscribe to RSS Feed
- Permalink
- Report Inappropriate Content
Line chart Multiple expressions and One line
Hello,
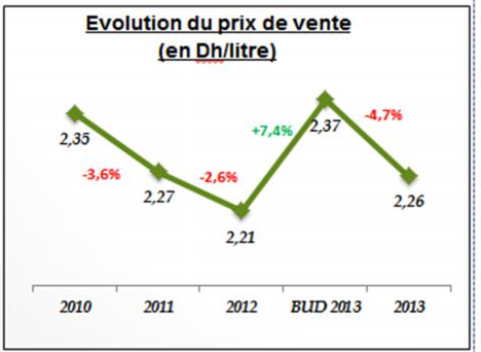
Is it possible to have in a line chart multiple expressions , one dimension in one line.
Expressions are ( sales N-3 ,sales N-2, sales N-1, budget N, sales N), dimension Year
please see the screenshot to better understand my needs
Thank You.
- « Previous Replies
- Next Replies »
- Mark as New
- Bookmark
- Subscribe
- Mute
- Subscribe to RSS Feed
- Permalink
- Report Inappropriate Content
Hello!
It's Ok, I always glad to help 😃
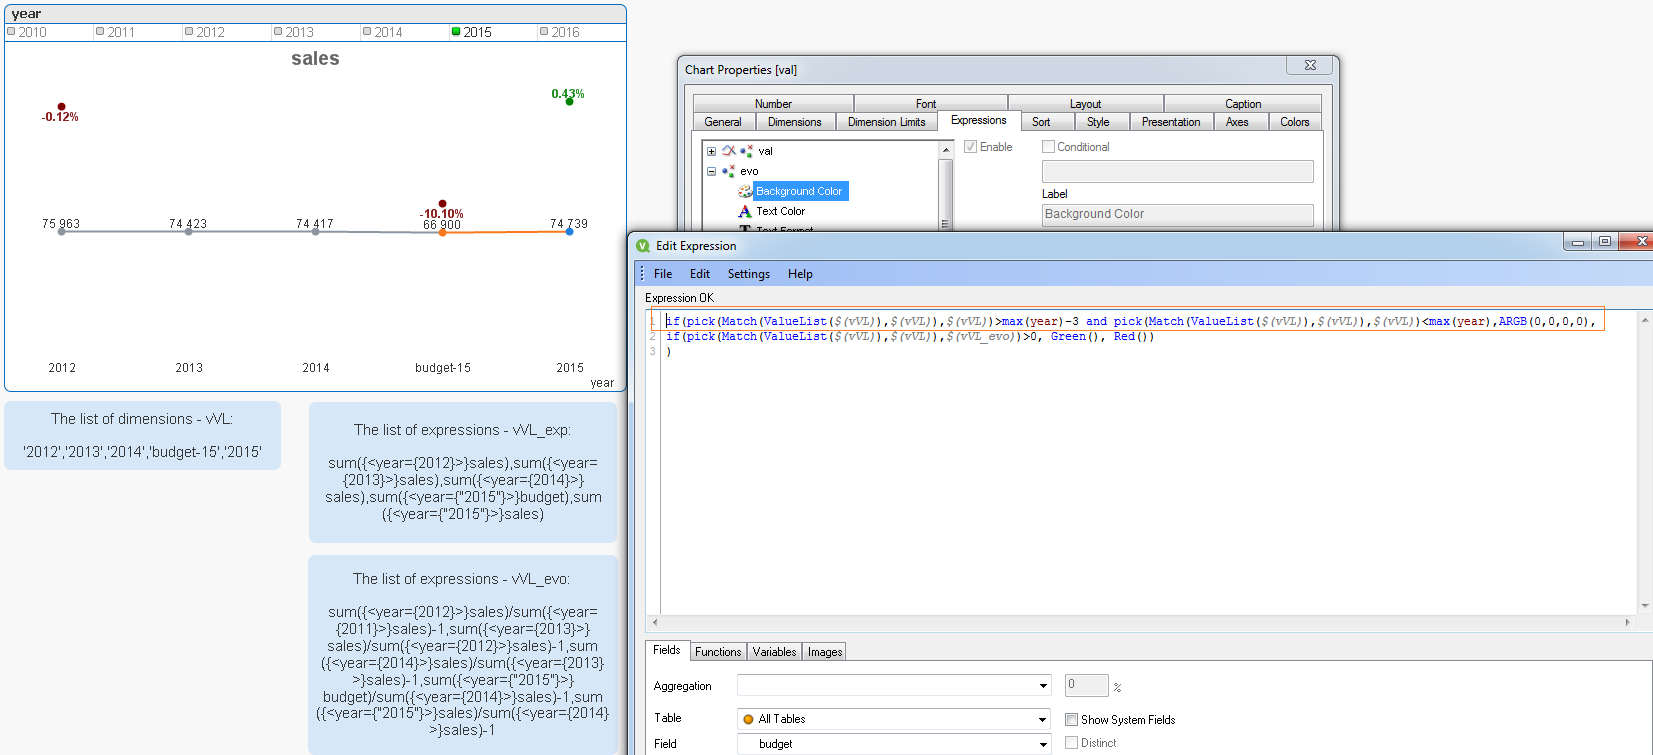
For hiding some dots and texts you can use this additional row on background color condition:
And as you can see I've added one more year to the chart. You can do so by changing just one parameter:
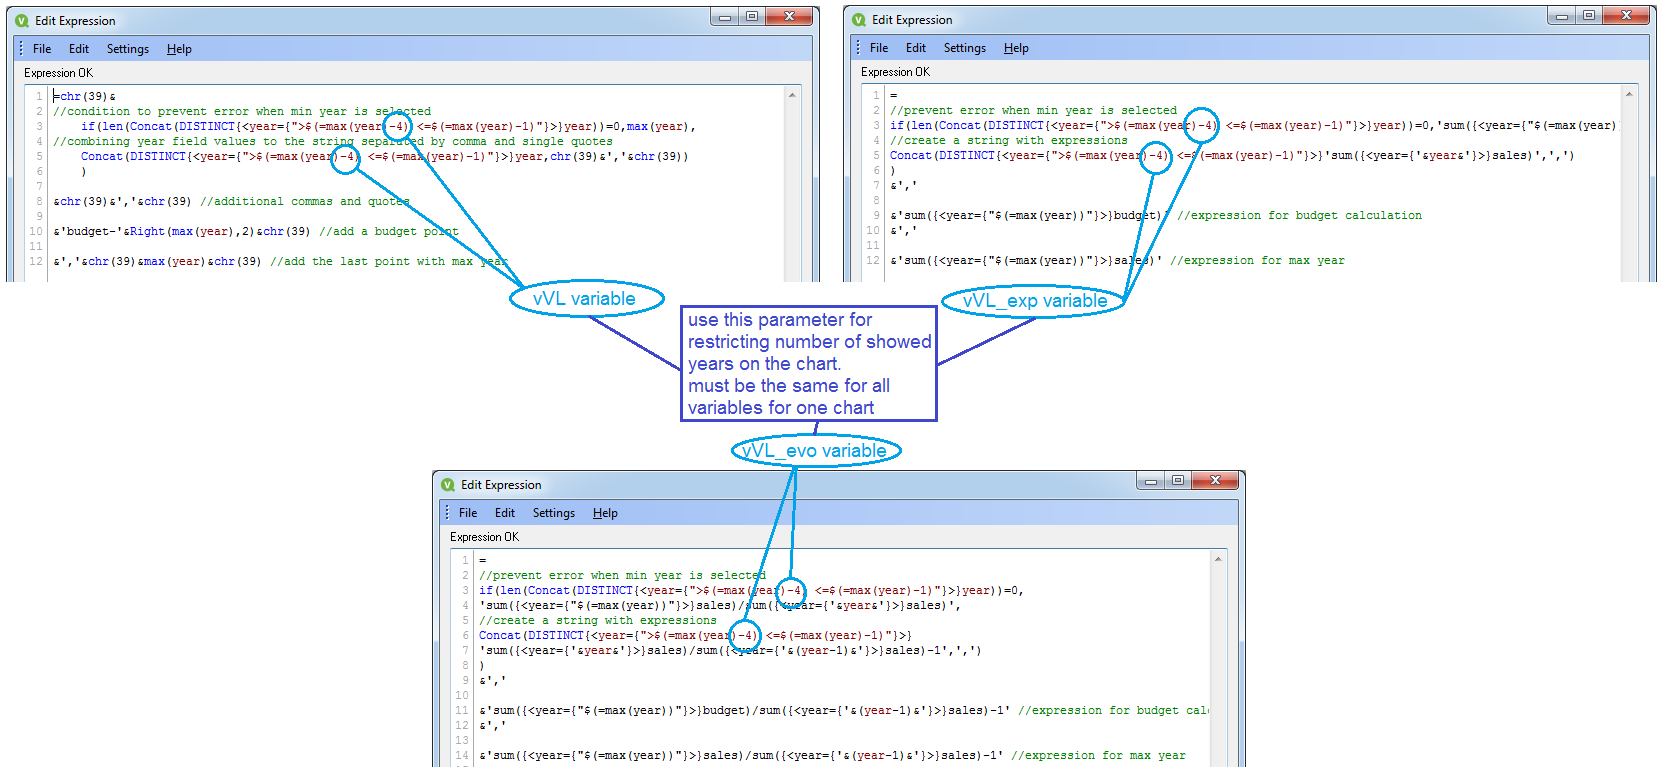
Let's call it a "year parameter".
And I think, if you need to use another chart with different number of years, then it should be a new couple of variables, like vVL_chart2, vVL_exp_chart2 and vVL_evo_chart2 with "year parameter" equal 5 or 6 or whatever you needed.
Hope I understood you right with dots issue and please don't be shy for asking!
- Mark as New
- Bookmark
- Subscribe
- Mute
- Subscribe to RSS Feed
- Permalink
- Report Inappropriate Content
Hi,
thank you so much for all your helpful answers.
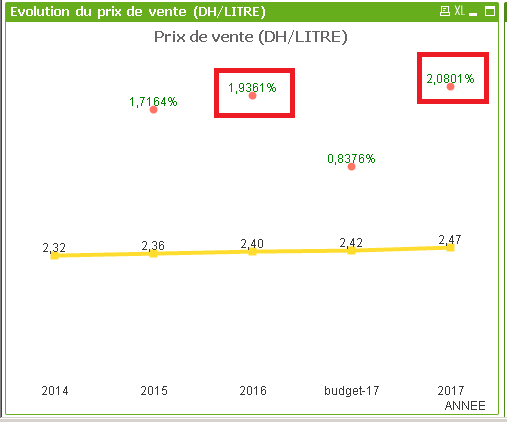
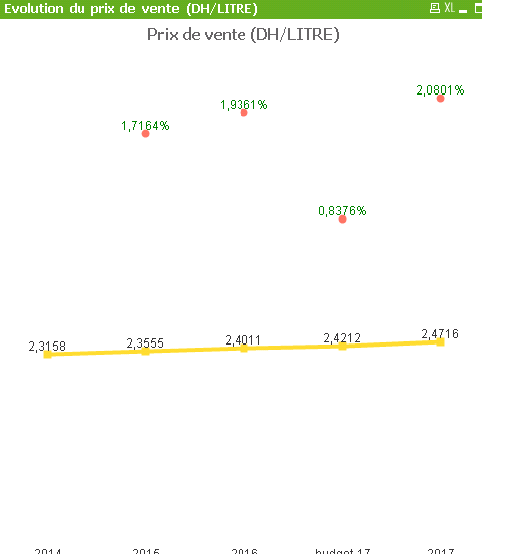
i have now the result i want ; i added one more year to the gaphe and i calculate the evolution in percentage which is the difference between the dots. but i have two percentage that are not correct please see the screenshot.
(2,36/2,32)-1 = 1,71 --> OK
(2,4/2,36)-1 = 1,69 --> KO
(2,42/2,4)-1 = 0,83 --> OK
(2,47/2,42)-1 = 2,066 --> KO
here is the code of the vVL_evo :
=
//prevent error when min year is selected
if(len(Concat(DISTINCT{<ANNEE={">$(=max(ANNEE)-4) <=$(=max(ANNEE)-1)"}>}ANNEE))=0,
'(sum({<ANNEE={"$(=max(ANNEE))"}>}CA_NET_EN_DH)/sum({<ANNEE={"$(=max(ANNEE))"}>}CA_NET_EN_LITRE))/(sum({<ANNEE={'&(ANNEE-1)&'}>}CA_NET_EN_DH)/sum({<ANNEE={'&(ANNEE-1)&'}>}CA_NET_EN_LITRE))-1',
//create a string with expressions
Concat(DISTINCT{<ANNEE={">$(=max(ANNEE)-4) <=$(=max(ANNEE)-1)"}>}'(sum({<ANNEE={'&ANNEE&'}>}CA_NET_EN_DH)/sum({<ANNEE={'&ANNEE&'}>}CA_NET_EN_LITRE))/(sum({<ANNEE={'&(ANNEE-1)&'}>}CA_NET_EN_DH)/sum({<ANNEE={'&(ANNEE-1)&'}>}CA_NET_EN_LITRE))-1',',')
)
&','
&'(sum({<ANNEE={"$(=max(ANNEE))"}>}BUDGET_CA_NET_DH)/sum({<ANNEE={"$(=max(ANNEE))"}>}BUDGET_CA_NET_LITRE))/(sum({<ANNEE={'&(ANNEE-1)&'}>}CA_NET_EN_DH)/sum({<ANNEE={'&(ANNEE-1)&'}>}CA_NET_EN_LITRE))-1' //expression for budget calculation
&','
&'(sum({<ANNEE={"$(=max(ANNEE))"}>}CA_NET_EN_DH)/sum({<ANNEE={"$(=max(ANNEE))"}>}CA_NET_EN_LITRE))/ (sum({<ANNEE={"$(=max(ANNEE))"}>}BUDGET_CA_NET_DH)/sum({<ANNEE={"$(=max(ANNEE))"}>}BUDGET_CA_NET_LITRE))-1'//expression for max yea
the sales indicator in my case is '(sum({<ANNEE={"$(=max(ANNEE))"}>}CA_NET_EN_DH)/sum({<ANNEE={"$(=max(ANNEE))"}>}CA_NET_EN_LITRE))'
the budget indicator is : '(sum({<ANNEE={"$(=max(ANNEE))"}>}BUDGET_CA_NET_DH)/sum({<ANNEE={"$(=max(ANNEE))"}>}BUDGET_CA_NET_LITRE))'
thank you so much
- Mark as New
- Bookmark
- Subscribe
- Mute
- Subscribe to RSS Feed
- Permalink
- Report Inappropriate Content
Hello!
I don't think that there are some mistakes. Check the precision of values, because for 2016 year it will be: 2,36 x 1,019361 = 2,40
- Mark as New
- Bookmark
- Subscribe
- Mute
- Subscribe to RSS Feed
- Permalink
- Report Inappropriate Content
Thank you for your answer, but for the year 2016 the evolution i have Is 1,9361%
however the right value is :
(2,4/2,36)-1=0,01694 and in percentage it gives : 1,69 %
i have the same precision for all the points why just 2016 and 2017 give me a wrong values.
- Mark as New
- Bookmark
- Subscribe
- Mute
- Subscribe to RSS Feed
- Permalink
- Report Inappropriate Content
Hello!
Can you please add more decimals to the values on the chart and place a screenshot?
- Mark as New
- Bookmark
- Subscribe
- Mute
- Subscribe to RSS Feed
- Permalink
- Report Inappropriate Content
yes of course
here is the screenshot
- Mark as New
- Bookmark
- Subscribe
- Mute
- Subscribe to RSS Feed
- Permalink
- Report Inappropriate Content
Hello!
I've made some calculating things in Excel and here what I've got:
| year | dh/litre | Excel | QV | diff |
| 2014 | 2,3158 | - | - | - |
| 2015 | 2,3555 | 1,7143% | 1,7164% | 0,0021% |
| 2016 | 2,4011 | 1,9359% | 1,9361% | 0,0002% |
| budget | 2,4212 | 0,8371% | 0,8376% | 0,0005% |
| 2017 | 2,4716 | 2,0816% | 2,0801% | -0,0015% |
And I think if you'll add more decimals (about ten) you'll get the "diff" column values about absolute zero.
- Mark as New
- Bookmark
- Subscribe
- Mute
- Subscribe to RSS Feed
- Permalink
- Report Inappropriate Content
thank you so much for your help,
So i can't have the right value with two numbers after the commas.
- Mark as New
- Bookmark
- Subscribe
- Mute
- Subscribe to RSS Feed
- Permalink
- Report Inappropriate Content
Hello!
You can make any changes in vVL_evo expressions output list, even roundind. Should be something like this:
Concat(
DISTINCT{<ANNEE={">$(=max(ANNEE)-4) <=$(=max(ANNEE)-1)"}>}
'Round(
sum({<ANNEE={'&ANNEE&'}>}CA_NET_EN_DH)/sum({<ANNEE={'&ANNEE&'}>}CA_NET_EN_LITRE)
,0.01)
/
Round(
sum({<ANNEE={'&(ANNEE-1)&'}>}CA_NET_EN_DH)/sum({<ANNEE={'&(ANNEE-1)&'}>}CA_NET_EN_LITRE)
,0.01)
-1'
,',')
- « Previous Replies
- Next Replies »