Unlock a world of possibilities! Login now and discover the exclusive benefits awaiting you.
- Qlik Community
- :
- Forums
- :
- Analytics
- :
- New to Qlik Analytics
- :
- Colour two maps based on the same value scale
- Subscribe to RSS Feed
- Mark Topic as New
- Mark Topic as Read
- Float this Topic for Current User
- Bookmark
- Subscribe
- Mute
- Printer Friendly Page
- Mark as New
- Bookmark
- Subscribe
- Mute
- Subscribe to RSS Feed
- Permalink
- Report Inappropriate Content
Colour two maps based on the same value scale
Hi all,
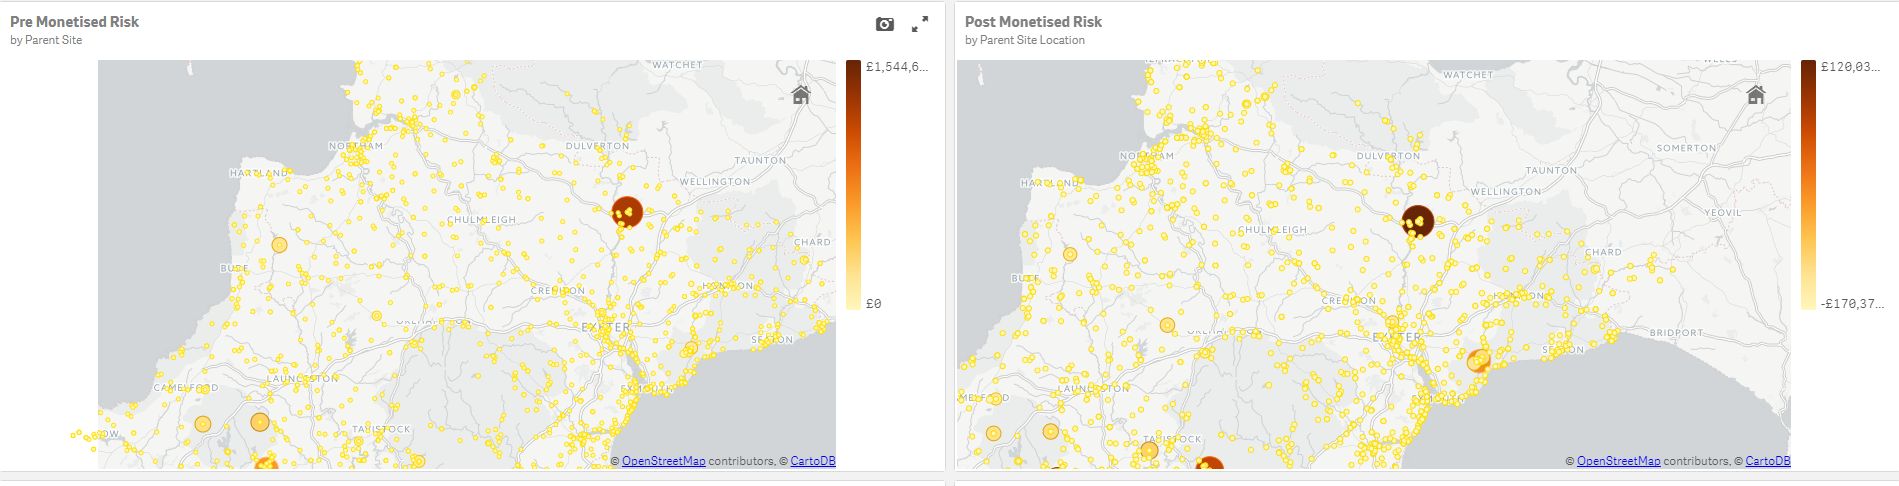
I have two maps, side by side, that show pre- and post - investment values. The post investment values are much smaller, as the more investment has minimised the risk.
I'd like the second maps to instantly show the lower values through smaller bubble sizes and lighter colours, but as Sense colours each map depending on the min max scale of values there's no appreciable difference.
I've tried altering the range of the post map to use the max value of the pre value but to no avail.
Is there any way I can colour both maps by the same scale to highlight the difference?
- Mark as New
- Bookmark
- Subscribe
- Mute
- Subscribe to RSS Feed
- Permalink
- Report Inappropriate Content
color by expression and create your own borns
- Mark as New
- Bookmark
- Subscribe
- Mute
- Subscribe to RSS Feed
- Permalink
- Report Inappropriate Content
Hi there,
I've tried that, but the value span is so massive (its billions of pounds) it's just impractical to do so (sadly).