Unlock a world of possibilities! Login now and discover the exclusive benefits awaiting you.
- Qlik Community
- :
- Forums
- :
- Analytics
- :
- New to Qlik Analytics
- :
- Re: Rolling sum on Qlik Sense
- Subscribe to RSS Feed
- Mark Topic as New
- Mark Topic as Read
- Float this Topic for Current User
- Bookmark
- Subscribe
- Mute
- Printer Friendly Page
- Mark as New
- Bookmark
- Subscribe
- Mute
- Subscribe to RSS Feed
- Permalink
- Report Inappropriate Content
Rolling sum on Qlik Sense
Hi all,
I need to build a "rolling sum" plot (or table as well), i. e. a sum that month by month runs on the latest 12 months.
More precisely, I have a graph that shows a variable (the number of sold products) month by month.
The other variable I want to show is the sum of sold products on one year up to that month.
The result should be a plot showing (month by month) the units sold in that month (e.g. March 2017) and the units sold on one year that far (e.g. April 2016 - March 2017).
I hope the request is clear.
Any help would be very appreciated.
Thanks, LuigiZ
- Tags:
- rolling sum
- Mark as New
- Bookmark
- Subscribe
- Mute
- Subscribe to RSS Feed
- Permalink
- Report Inappropriate Content
you'll find the qvf file in C:\Users\your_windows_account\Documents\Qlik\Sense\Apps
- Mark as New
- Bookmark
- Subscribe
- Mute
- Subscribe to RSS Feed
- Permalink
- Report Inappropriate Content
Does it pass even the data?
(they are company sensitive, and it's better for me not to pass them)
- Mark as New
- Bookmark
- Subscribe
- Mute
- Subscribe to RSS Feed
- Permalink
- Report Inappropriate Content
Create sample app with sample data
- Mark as New
- Bookmark
- Subscribe
- Mute
- Subscribe to RSS Feed
- Permalink
- Report Inappropriate Content
ok I suggest you to create an excel file with all data you are using within your chart object and next create a new app reading that excel file.
- Mark as New
- Bookmark
- Subscribe
- Mute
- Subscribe to RSS Feed
- Permalink
- Report Inappropriate Content
Here it is
- Mark as New
- Bookmark
- Subscribe
- Mute
- Subscribe to RSS Feed
- Permalink
- Report Inappropriate Content
I C&P the app's file, then changed the base csv file
- Mark as New
- Bookmark
- Subscribe
- Mute
- Subscribe to RSS Feed
- Permalink
- Report Inappropriate Content
which is the chart object involved?
- Mark as New
- Bookmark
- Subscribe
- Mute
- Subscribe to RSS Feed
- Permalink
- Report Inappropriate Content
you get 0 as result because you have data only for 2011 year, at least for the app you sent.
- Mark as New
- Bookmark
- Subscribe
- Mute
- Subscribe to RSS Feed
- Permalink
- Report Inappropriate Content
Sorry, yesteday I was in a hurry and made some mess.
Here is the relevant part of my app, with data on a wider timeframe.
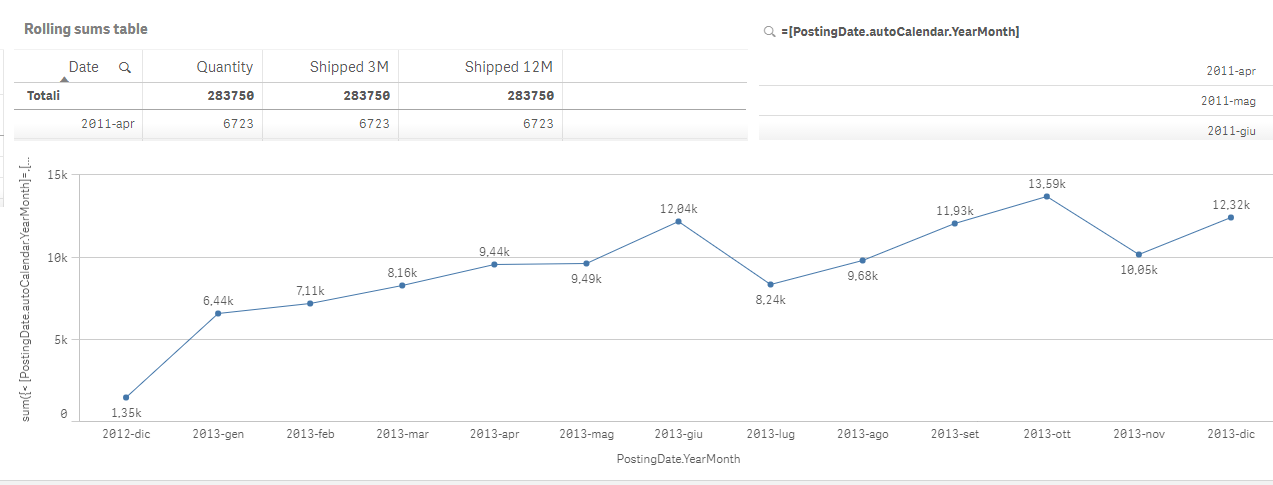
The interested table is "Rolling sum table" (where I tried to add a 3 months rolling sum), and Rolling sum plot.
The result of the suggested formula gives me simply the sum over the month. I can't find what's wrong.
- Mark as New
- Bookmark
- Subscribe
- Mute
- Subscribe to RSS Feed
- Permalink
- Report Inappropriate Content
Here's ur expression :
sum({< [PostingDate.autoCalendar.YearMonth]=,[PostingDate.autoCalendar.Year]=,[PostingDate.autoCalendar.Month]=,[PostingDate.autoCalendar.Date]=,
[PostingDate.autoCalendar.Date]={">=$(=addMonths(max([PostingDate.autoCalendar.Date]),-12))<=$(=max([PostingDate.autoCalendar.Date]))"}>}Quantity)
result: