Unlock a world of possibilities! Login now and discover the exclusive benefits awaiting you.
- Qlik Community
- :
- All Forums
- :
- QlikView App Dev
- :
- Re: How to display the x axis showing 30 minute in...
- Subscribe to RSS Feed
- Mark Topic as New
- Mark Topic as Read
- Float this Topic for Current User
- Bookmark
- Subscribe
- Mute
- Printer Friendly Page
- Mark as New
- Bookmark
- Subscribe
- Mute
- Subscribe to RSS Feed
- Permalink
- Report Inappropriate Content
How to display the x axis showing 30 minute intervals in my chart
Hi ,
I have a requirement to display the time every 30 mintues within the period.
This is the screen shot of present chart.
Here i want between 8 -17hrs , the chart should display 8, 8.30 , 9, 9.30 ........16.30, 17.
Can anyone help me pls?
regards,
vamsi.
- Mark as New
- Bookmark
- Subscribe
- Mute
- Subscribe to RSS Feed
- Permalink
- Report Inappropriate Content
Can you use Static Step for X-Axis like 0:30 or 0.3 ??
- Mark as New
- Bookmark
- Subscribe
- Mute
- Subscribe to RSS Feed
- Permalink
- Report Inappropriate Content
Hi,
If you create a New table like this.
Halfhour:
LOAD
hour(ceil(RowNo()-1)/48) as HourKey,
time((RowNo()-1)/48) as HalfHour
Autogenerate(48);
Connect it With the Field Hours in Your calendar or where you have it. Then use HalfHour as Dimension in chart.
LOAD
Date,
Year,
month,
Hours,
Hours as HourKey
....
....
- Mark as New
- Bookmark
- Subscribe
- Mute
- Subscribe to RSS Feed
- Permalink
- Report Inappropriate Content
Hi steffan
thanks for your reply.
I am using the if statement in the script as the working ours are between 8:00 hrs -17:00 hrs.
How can I integreate your statement in the load script.
Any suggestion,
This is what i am using in the load script
IF(Hour(Interval(created_at,'hh:mm')) >= '09:30' AND Hour(Interval(created_at,'hh:mm')) <='17:30', Hour(Interval(created_at,'hh:mm'))),
timestamp(floor(created_at) + Maketime(hour(created_at)), 'hh:mm') as MyHour,
=IF(Hour(Interval(created_at,'hh')) >= 8 AND Hour(Interval(created_at,'hh')) <=17 ,Hour(Interval(created_at,'hh')))
i wonder if you can help me out by changing the experssion.
- Mark as New
- Bookmark
- Subscribe
- Mute
- Subscribe to RSS Feed
- Permalink
- Report Inappropriate Content
What if you create HalfHour from Your Field created_at?
TimeStamp(Floor(created_at, 1/48), 'hh:mm') as HalfHour, then use HalfHour as Dimension.
Expression would be something like
sum({<HalfHour={">=$(=time('08:00'))<=$(=time('17:00'))"}>}Value)
- Mark as New
- Bookmark
- Subscribe
- Mute
- Subscribe to RSS Feed
- Permalink
- Report Inappropriate Content
Hi Stefan,
I have followed the your steps and i am getting like this in the chart.
Do you think am i missing anything.?
regards,
Vamsi.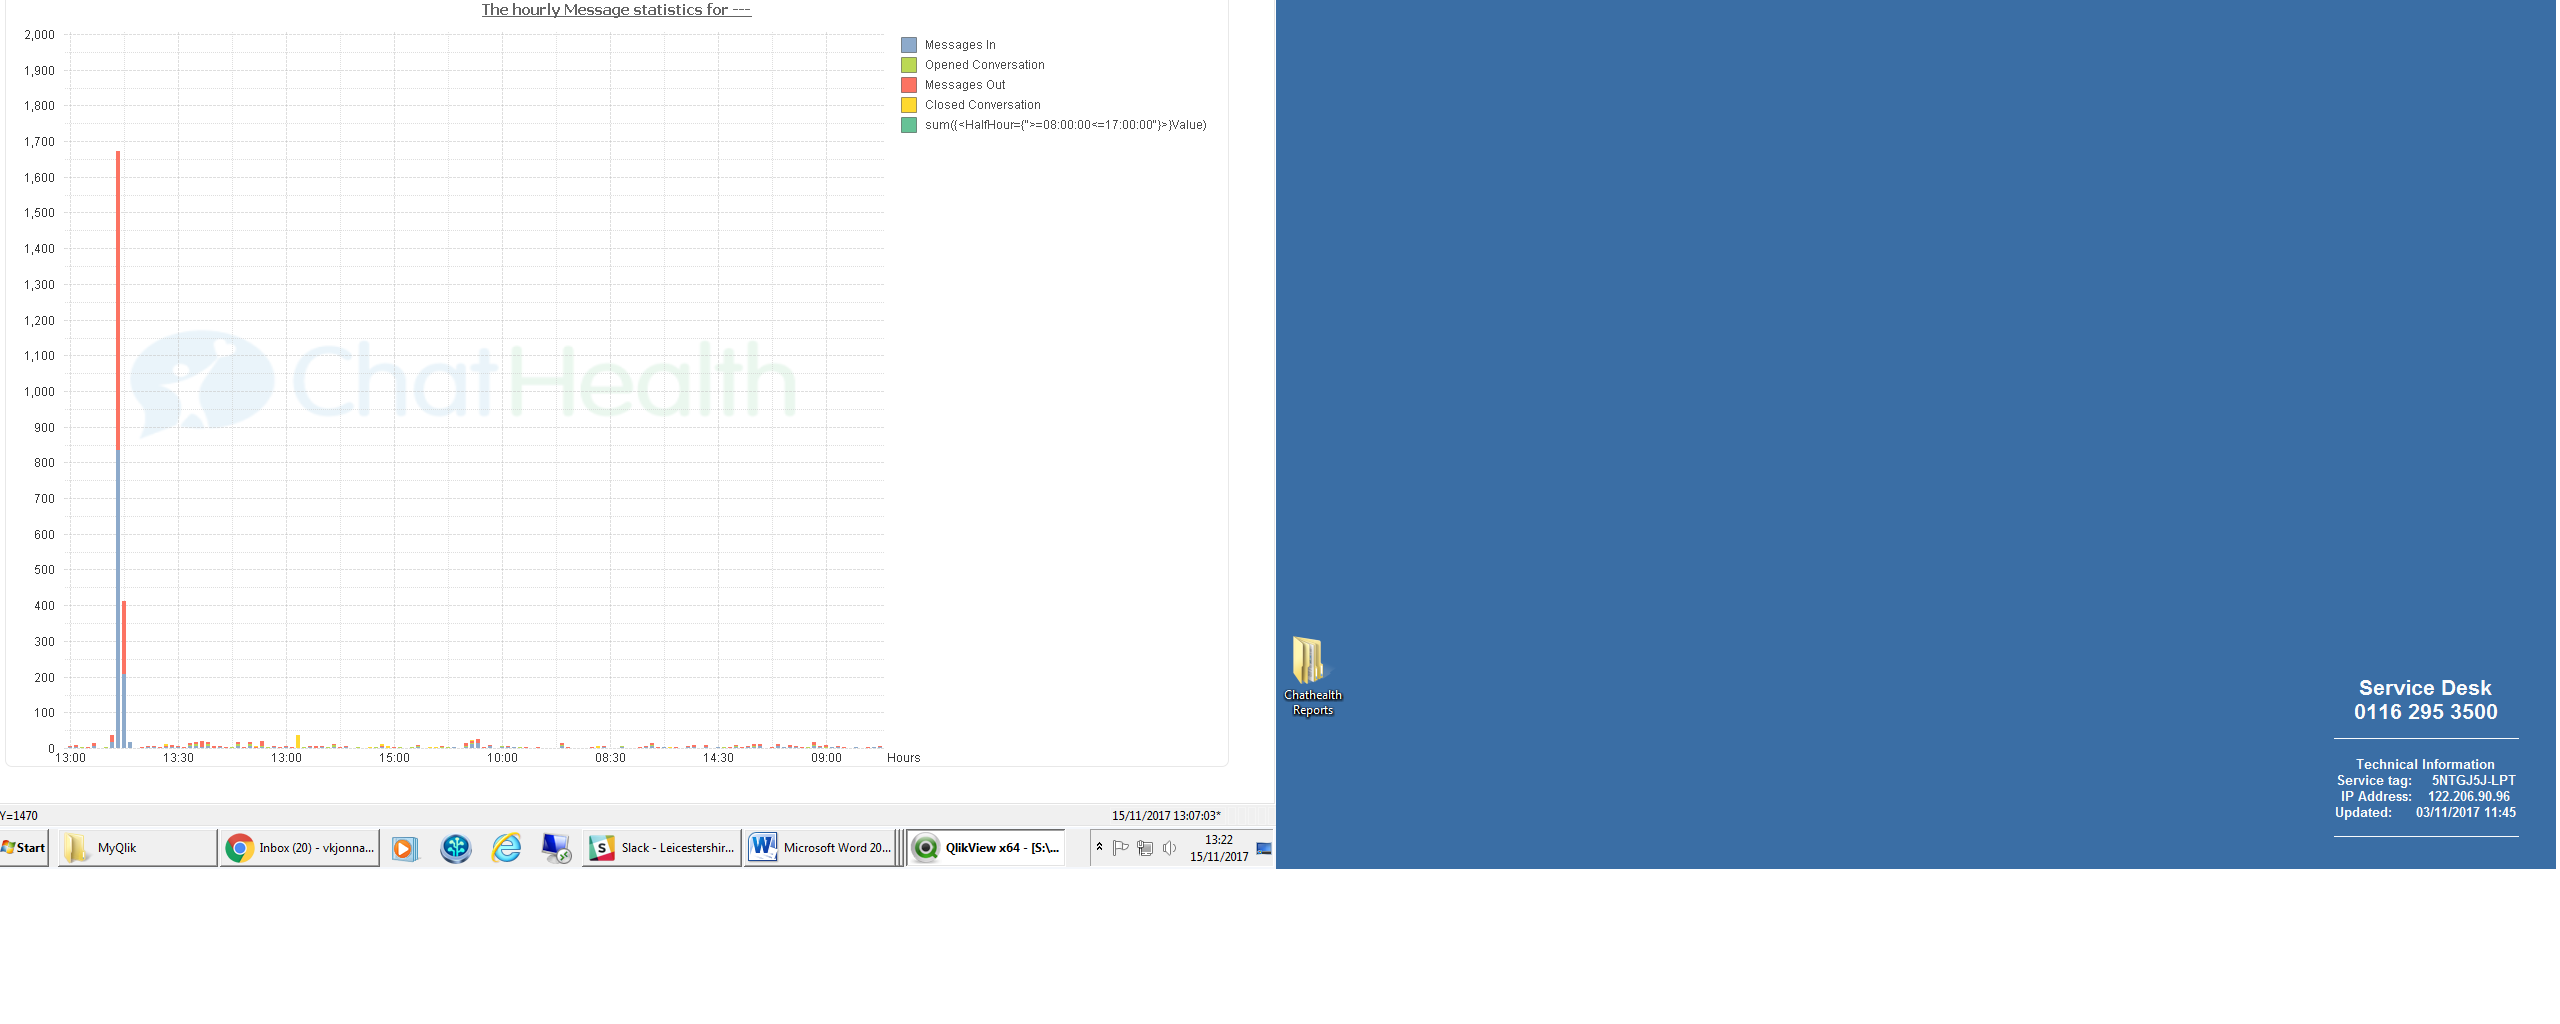
- Mark as New
- Bookmark
- Subscribe
- Mute
- Subscribe to RSS Feed
- Permalink
- Report Inappropriate Content
You can not use Sum({<.............>}Value. Value is just a dummy.
You have to use Your measure, I dont know if you do a Count or sum or what your measure is.
- Mark as New
- Bookmark
- Subscribe
- Mute
- Subscribe to RSS Feed
- Permalink
- Report Inappropriate Content
oh i see.. got it
i will use it accordingly, and let you know
Thanks for your help.
much appreciated.