Unlock a world of possibilities! Login now and discover the exclusive benefits awaiting you.
- Qlik Community
- :
- Forums
- :
- Analytics
- :
- New to Qlik Analytics
- :
- Re: Can we put condition in max function
- Subscribe to RSS Feed
- Mark Topic as New
- Mark Topic as Read
- Float this Topic for Current User
- Bookmark
- Subscribe
- Mute
- Printer Friendly Page
- Mark as New
- Bookmark
- Subscribe
- Mute
- Subscribe to RSS Feed
- Permalink
- Report Inappropriate Content
Can we put condition in max function
Hi
I want to apply a condition in max function.
Max({<[Fiscal Year]='FY16'>}( mid(Quarters,2)))
Ideally it should give me 4, but its not returning any value.
- Mark as New
- Bookmark
- Subscribe
- Mute
- Subscribe to RSS Feed
- Permalink
- Report Inappropriate Content
Found out... in the application... I am seeing two sheets, which sheet and chart are we working with  . Still trying to narrow down on what I should be focusing on
- Mark as New
- Bookmark
- Subscribe
- Mute
- Subscribe to RSS Feed
- Permalink
- Report Inappropriate Content
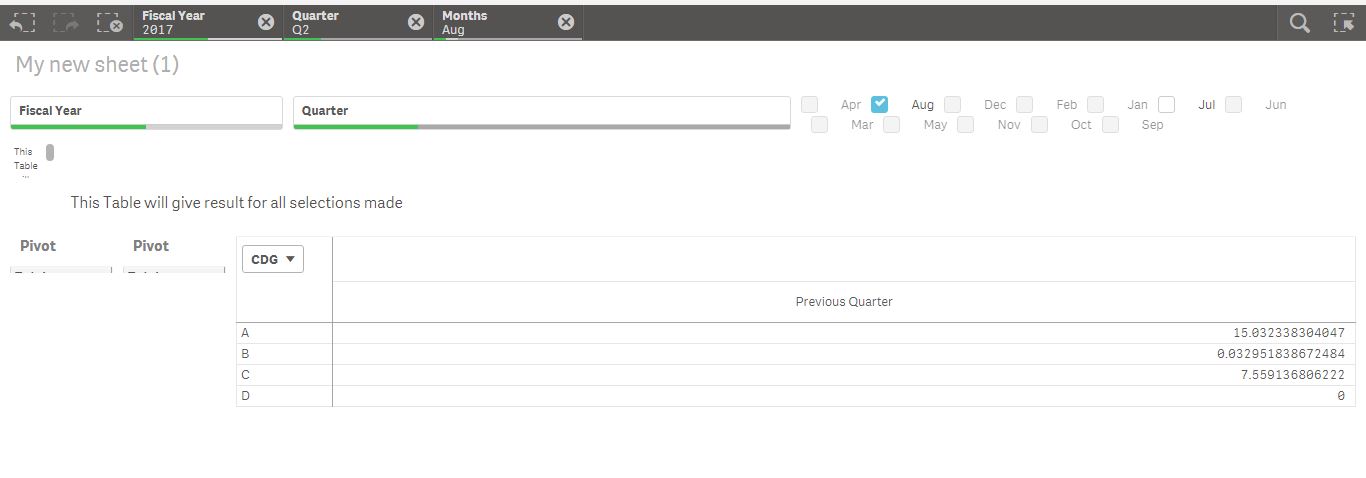
My new sheet(1)
There 2 pivots are there..
Both are working.
One is based on max(quarterStart) or max(MonthStart).
Another is based on p()
- Mark as New
- Bookmark
- Subscribe
- Mute
- Subscribe to RSS Feed
- Permalink
- Report Inappropriate Content
So, I have been brought a little up to speed by shraddha.g, now I would like you to tell me what exactly do you mean when you say you want to combine them? Can you tell me what you envision the numbers to look like (with and without selections) when the two charts are combined into one?
- Mark as New
- Bookmark
- Subscribe
- Mute
- Subscribe to RSS Feed
- Permalink
- Report Inappropriate Content
Hi Sunny thanks for coming in,
there has been a little change in requirement , in a nutshell ,now i want multiple selections for quarter and single selection for month.
If the user selects a particular quarter for ex Q2 data of Q1 should be shown. If he selects quarter->Q2 and month->Aug data of Quarter->Q1 and month->May should be shown under previous header. Previous quarter when we select Q1 should return Q4 quarter data for the previous year.
These functionalities should work for multiple selections as well in quarters.
Now Shraddha has helped me a lot in achieving this , and i am able to get previous quarter data over multiple selections. I want to basically club the multiple quarter selections condition and month selection condition in a single sum expression.
- Mark as New
- Bookmark
- Subscribe
- Mute
- Subscribe to RSS Feed
- Permalink
- Report Inappropriate Content
All the functionalities are working well Shraddha but when i select months the previous quarter measure goes blank, so my sample output should be
Sample 1.
Current Quarter Selection Mon
Q2 Aug
Should show me data for Q1 May under previous.
Sample 2
Current Quarter Selection Mon
Q3 Oct,
Q2 Aug
Should show me data for Q2 July and Q1 May under previous.
Only single selections are allowed for months column.
- Mark as New
- Bookmark
- Subscribe
- Mute
- Subscribe to RSS Feed
- Permalink
- Report Inappropriate Content
What you are saying make sense, but I am not sure I can translate all this into numbers... What I am looking for is expected output based on few different selections. I know how the numbers look in two different charts, what I am not sure is that what you expect to see when the expressions are combined? Just Exp1 + Exp2? Or something else? Does that make sense?
- Mark as New
- Bookmark
- Subscribe
- Mute
- Subscribe to RSS Feed
- Permalink
- Report Inappropriate Content
Can you update the expression for previous months you are using to -3 ,like for mar it should show January..
- Mark as New
- Bookmark
- Subscribe
- Mute
- Subscribe to RSS Feed
- Permalink
- Report Inappropriate Content
Hi Sunny,
Now its working fine if I select quarters and months simultaneously.
I just combined previous month and quarter selection in if statement. My measure is as follows.
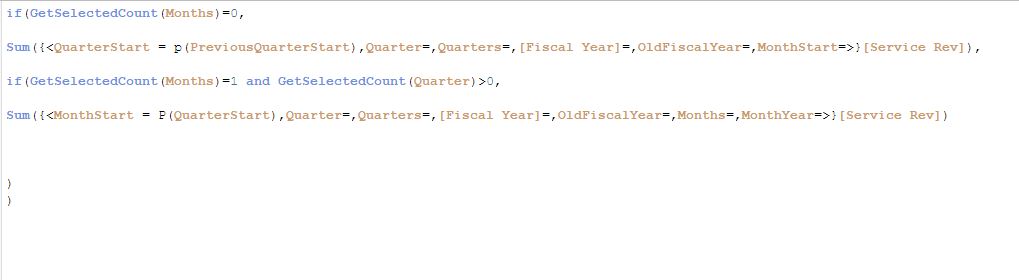
The only thing I want is that instead of monthstart showing me the -1 month(for ex feb for march) it should return me -3 month(for ex jan for march)
- Mark as New
- Bookmark
- Subscribe
- Mute
- Subscribe to RSS Feed
- Permalink
- Report Inappropriate Content
I am not sure, but this part of your expression should already be doing this?
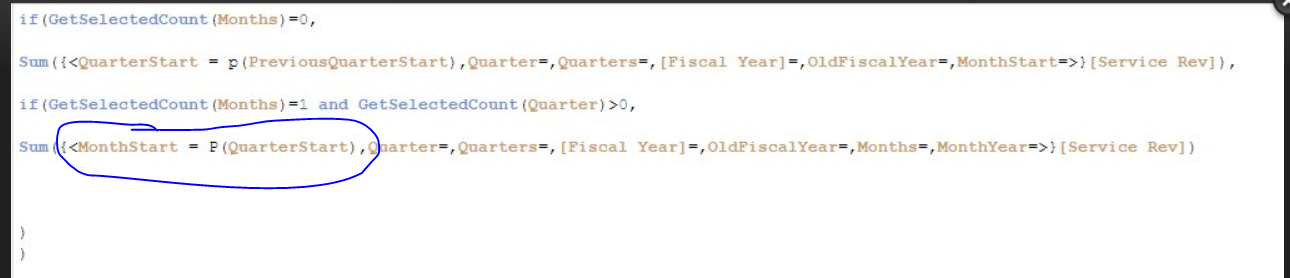
For March, it should give you Jan... but do you also want April to give you Feb?
- Mark as New
- Bookmark
- Subscribe
- Mute
- Subscribe to RSS Feed
- Permalink
- Report Inappropriate Content
Yea Sunny exactly.
My sample output should be
Sample 1.
Current Quarter Selection Mon
Q2 Aug
Should show me data for Q1 May under previous.
Sample 2
Current Quarter Selection Mon
Q3 Oct,
Q2 Aug
Should show me data for Q2 July and Q1 May under previous.
Only single selections are allowed for months column.