Unlock a world of possibilities! Login now and discover the exclusive benefits awaiting you.
- Qlik Community
- :
- All Forums
- :
- QlikView App Dev
- :
- Google Map Keeps Vanishing
- Subscribe to RSS Feed
- Mark Topic as New
- Mark Topic as Read
- Float this Topic for Current User
- Bookmark
- Subscribe
- Mute
- Printer Friendly Page
- Mark as New
- Bookmark
- Subscribe
- Mute
- Subscribe to RSS Feed
- Permalink
- Report Inappropriate Content
Google Map Keeps Vanishing
I am having a really strange issue when overlaying a scatter on Google maps. On saving and reopening the app the dynamic image in this case the map keeps dropping out and seems to only come back after closing the Qlikview application leaving it for an extended period of time and then reopening (although this is still a bit hit and miss).
The version of Qlikview being used is Qlikview 10 r2
And the approach being taken in the script is:
// Google Maps Key
// get a key here http://code.google.com/apis/maps/signup.htmlgmap_key = 'xx';max_zoom_level = 12; //maximum value 17 // Variables required for calculating map
// No need to change thesevar_pi180= '=pi()/180';var_lat_offset= '0';var_mc2= '=256*pow(2,$(var_zoom))';var_mc1= '=256*pow(2,($(var_zoom)-1))';var_mid_lat= '=min(latitude)+(1+var_lat_offset)*((max(latitude)-min(latitude))/2)';var_mid_long= '=min(longitude)+(max(longitude)-min(longitude))/2';var_zoom= '=max(aggr(if(max( round(256*pow(2,(_zoom_level -1)))+( longitude *((256*pow(2,_zoom_level ))/360)) )-min( round(256*pow(2,(_zoom_level -1)))+( longitude *((256*pow(2,_zoom_level ))/360)) ) <map_size_x AND max((256*pow(2,(_zoom_level-1)))+((0.5*log((1+(sin((latitude)*pi()/180)))/(1-(sin((latitude)*pi()/180)))))*((-256*pow(2,_zoom_level))/(2*pi()))))-min((256*pow(2,(_zoom_level-1)))+((0.5*log((1+(sin((latitude)*pi()/180)))/(1-(sin((latitude)*pi()/180)))))*((-256*pow(2,_zoom_level))/(2*pi()))))<map_size_y,_zoom_level,1),_zoom_level))';var_maptype= '=if(isnull(only(maptype)),fieldvalue( '&chr(39)&'maptype'&chr(39)&', 1 ),maptype)';map_size_x= '530';map_size_y= '450';
SET HidePrefix='_' ;// Field required for calcualting best zoom level_zoom_level:Load RecNo( ) as _zoom_level autogenerate(max_zoom_level);
maptype:LOAD * INLINE [
maptype
roadmap
mobile
satellite
terrain
hybrid
];
And the syntax in the dynamic image is...
='http://maps.google.com/staticmap?center='
&num(var_mid_lat, '##############', '.', ',' )
&
','
&num(var_mid_long, '##############', '.', ',' )
&
'&zoom=$(var_zoom)'
&
'&maptype='&var_maptype
&
'&size='&map_size_x&'x'&map_size_y
&
'&key='&gmap_key & '.jpg'
I would appreciate any ideas how to stabilise this component of the app.
Regards
Kris
- Mark as New
- Bookmark
- Subscribe
- Mute
- Subscribe to RSS Feed
- Permalink
- Report Inappropriate Content
Open the example in the QlikView folder and copy/paste the script stuff and the dynamic imagine syntax. I have no clue if your's is right or not but as far as I know there's no reason to change any of that. Assuming everything is the same... I thought I read something about maps in v10 being different but since I have v9 so I don't have a clue.
Sorry I couldn't be more useful
- Mark as New
- Bookmark
- Subscribe
- Mute
- Subscribe to RSS Feed
- Permalink
- Report Inappropriate Content
The code being used is the same as shown in the standard Google maps demo/example. I have now been looking at the Idevio GIS extension and am having exactly the same issue, which is that the map sporadically disappears.
This is becoming stupidly frustrating!!!!
- Mark as New
- Bookmark
- Subscribe
- Mute
- Subscribe to RSS Feed
- Permalink
- Report Inappropriate Content
Hi Kris,
Did find an answer on your problem. I have the same problem at the moment!
Frank
- Mark as New
- Bookmark
- Subscribe
- Mute
- Subscribe to RSS Feed
- Permalink
- Report Inappropriate Content
In my case it was because I was using it within a container object. No
container n problem..
On 21 Dec 2011 15:22, "Frank Beunder" <
- Mark as New
- Bookmark
- Subscribe
- Mute
- Subscribe to RSS Feed
- Permalink
- Report Inappropriate Content
Hi All,
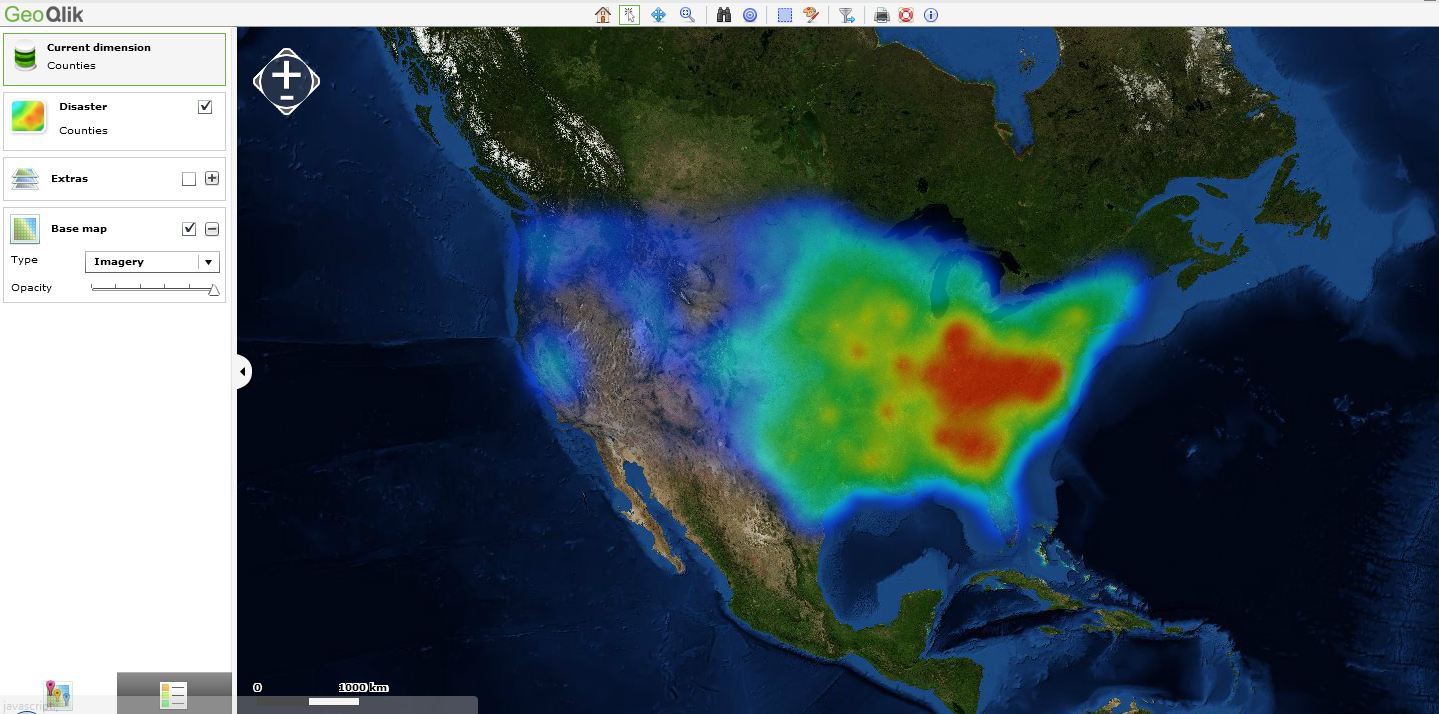
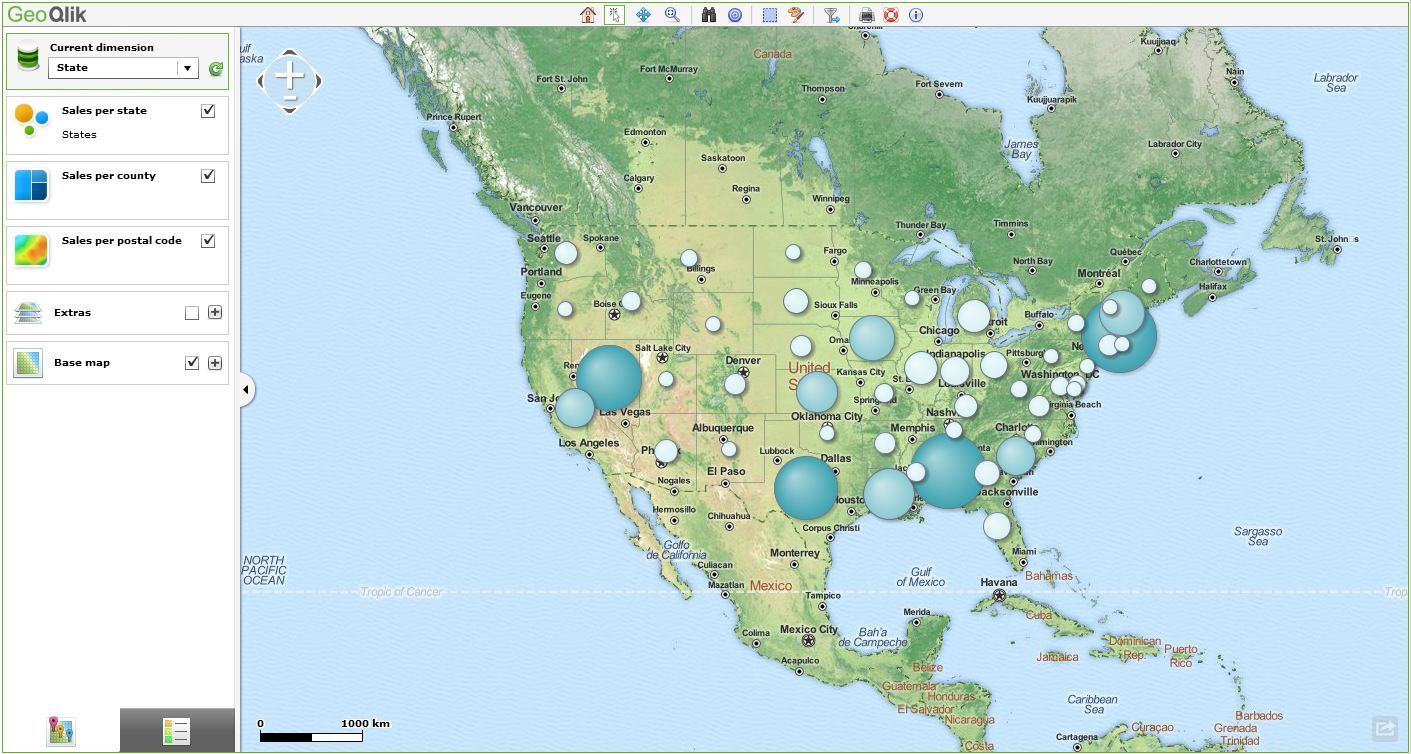
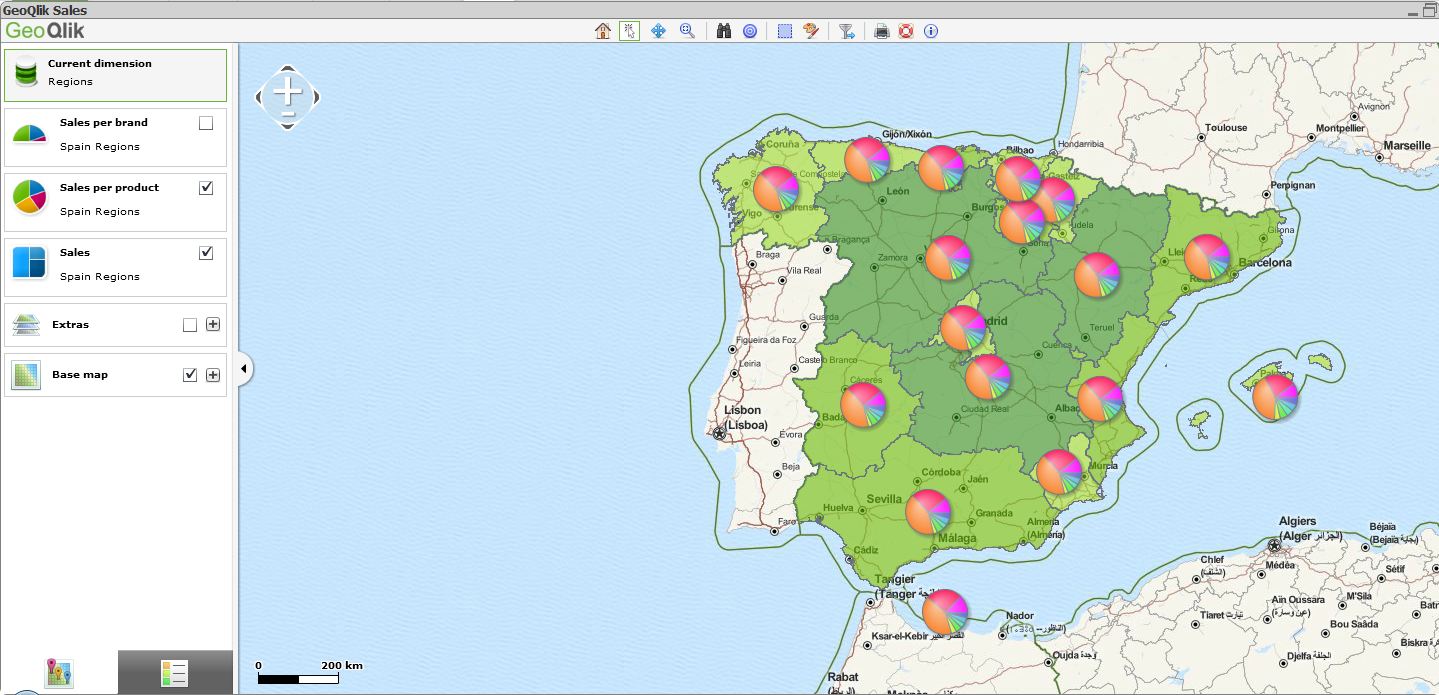
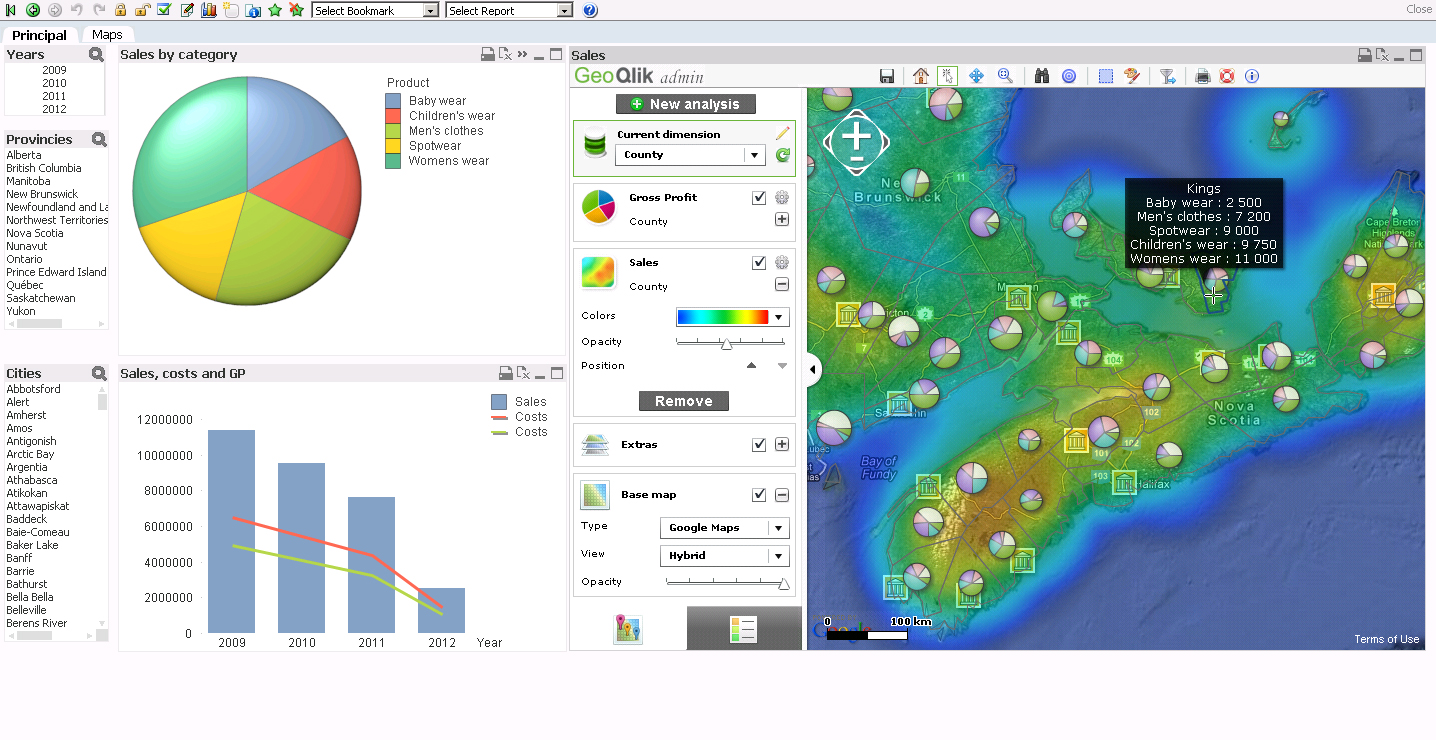
GIS/Maps Analytics in QlikView is a very interesting topic indeed.
However, there are many technical limitations in using Google Maps (GMaps) to display QlikView KPI indicators. First of all, the drill-down, pan and selection capabilities are quite limited. Moreover, you cannot display several indicators at the same time and on the same map (background + foreground indicators), you are also limited to draw bubbles and therefore you cannot display pie/bar charts nor "real" heat maps. Finally, you cannot display QlikView KPIs on specific Sales/Business Areas with GMaps such as the Bricks in the Pharmaceutical sector (Brick = aggregation of zipcodes).
On top of that, there are also a few "commercial" aspects to be considered since many QlikView customers & channel partners use GMaps API "FREE" Key inside their QlikView server or rich client without complying with GMaps license terms...Indeed, for "professional internal use" (intranet, extranet or internet with username/password authentication to QlikView application), you must buy GMaps API "Premier" which costs about 10,000 $ USD per year or 8,500 euros per year + possible extra fees depending upon the total number of daily hits.
A few alternatives exist such as Open Street Map (totally FREE) or other WMS/TMS services. I hereby suggest you to have a look at our new mapping extension for QlikView 11 SR1 namely "GeoQlik v11.6":
http://www.geoqlik.com/en/geoqlik-for-qlikview/geoqlik-v11.html
Please find hereafter a few screenshots of GeoQlik V11.6 using WMS/TMS services to display QlikView KPIs:
Thanks and best regards,
David
@ Business Geografic