Unlock a world of possibilities! Login now and discover the exclusive benefits awaiting you.
- Qlik Community
- :
- Forums
- :
- Analytics
- :
- New to Qlik Analytics
- :
- Re: how to design UI like attached file in Qlik Se...
- Subscribe to RSS Feed
- Mark Topic as New
- Mark Topic as Read
- Float this Topic for Current User
- Bookmark
- Subscribe
- Mute
- Printer Friendly Page
- Mark as New
- Bookmark
- Subscribe
- Mute
- Subscribe to RSS Feed
- Permalink
- Report Inappropriate Content
how to design UI like attached file in Qlik Sense
Hi all,
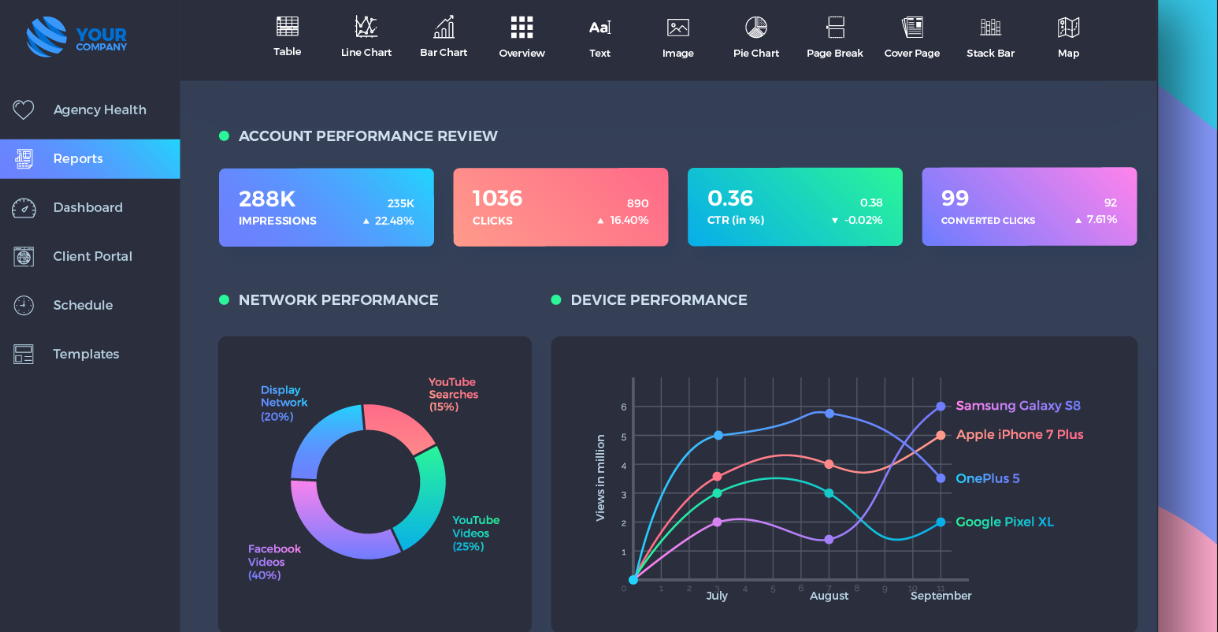
I wanted to develop dashboard in following format how to develop in Qlik sense ? any idea's
Thanks in adv
If the issue is solved please mark the answer with Accept as Solution & like it.
If you want to go quickly, go alone. If you want to go far, go together.
- Mark as New
- Bookmark
- Subscribe
- Mute
- Subscribe to RSS Feed
- Permalink
- Report Inappropriate Content
Which part in that image? And question not enough to reply because your question is long work. May be make short where and which report you are going to use. I assume, Qlikview has some limits where Qliksense doesn't. We can work anything using extensions / mashups / widget as we expertise on this in boommm..
- Mark as New
- Bookmark
- Subscribe
- Mute
- Subscribe to RSS Feed
- Permalink
- Report Inappropriate Content
Hey Vikas,
A bit more info would really help people to give you a more eloquent answer. This being said a good place to start is by taking a look at mashups in the developer hub. Those will help you, in the very least, get familiarised with using qlik sense visualisations in a Web application.
As per the design part you might want to check out bootstrap bootstrap and Leonardoui, both used in qlik sense itself. Basically two frameworks that sit as boilerplate for a lot of the code that you will need to write.
Cheers,
Alex
- Mark as New
- Bookmark
- Subscribe
- Mute
- Subscribe to RSS Feed
- Permalink
- Report Inappropriate Content
Thanks Anil
Can you please give which extension I can use ? what is to be done ?
If the issue is solved please mark the answer with Accept as Solution & like it.
If you want to go quickly, go alone. If you want to go far, go together.
- Mark as New
- Bookmark
- Subscribe
- Mute
- Subscribe to RSS Feed
- Permalink
- Report Inappropriate Content
Not existing one, We can create our own canvas extensions like visualization as satisfied by USER. You need to work on that. Before moving technical you may explain which is difficult for you..
- Mark as New
- Bookmark
- Subscribe
- Mute
- Subscribe to RSS Feed
- Permalink
- Report Inappropriate Content
I am totally new in this Qlik sense I have idea about how to use extensions , mushaps and code I have no idea
Can you please give me steps for creating own canvas extensions how to go for it ?
Vikas
If the issue is solved please mark the answer with Accept as Solution & like it.
If you want to go quickly, go alone. If you want to go far, go together.
- Mark as New
- Bookmark
- Subscribe
- Mute
- Subscribe to RSS Feed
- Permalink
- Report Inappropriate Content
Perhaps these
https://codepen.io/chris-creditdesign/pen/BIADJ
GitHub - bspoon/d3-canvas: Canvas rendering helpers for d3.js
- Mark as New
- Bookmark
- Subscribe
- Mute
- Subscribe to RSS Feed
- Permalink
- Report Inappropriate Content
You might also want to have a look here, especially at the Marketing360 app which is very close to what you are trying to achieve.
Now please bear in mind that you do need to have a solid understanding of HTML&CSS along with Javascript and the underlying libraries that deal with chart creation (such as D3) if you want to bind the data that makes up Qlik Sense visualizations to your own, custom visualizations.
You can also check this video out to get a rough feel for how mashups work.
Regards,
Alex