Unlock a world of possibilities! Login now and discover the exclusive benefits awaiting you.
- Qlik Community
- :
- All Forums
- :
- QlikView App Dev
- :
- Bar chart - missing bar gap
- Subscribe to RSS Feed
- Mark Topic as New
- Mark Topic as Read
- Float this Topic for Current User
- Bookmark
- Subscribe
- Mute
- Printer Friendly Page
- Mark as New
- Bookmark
- Subscribe
- Mute
- Subscribe to RSS Feed
- Permalink
- Report Inappropriate Content
Bar chart - missing bar gap
Hi,
The attached image displays the problem that i'm having. The blocks of bars surrounded by the orange boxes are countries (dimension, obviously), then there is one more dimension, the product that is sold in each country.
The countries shown in the image have some products in common, but not all products. As a result, there is a gap, a placeholder, for a missing product. I tried "suppressing" zeros, but that didn't change anything.
Any idea how I can go about resolving this issue?
Thanks,
Siarhei K.
- Tags:
- new_to_qlikview
- « Previous Replies
-
- 1
- 2
- Next Replies »
Accepted Solutions
- Mark as New
- Bookmark
- Subscribe
- Mute
- Subscribe to RSS Feed
- Permalink
- Report Inappropriate Content
I wasn't giving you the complete solution in that example, just the solution to your most recent problem. But if you combine the ideas of a concatenated dimension with RGB values assigned by product, you'll get what I think you want. I guess that wasn't clear. See attached. There are no gaps, the customers are grouped and the products are consistently colored.
(Yes, QlikView should really just have a checkbox to eliminate the gaps, or something along those lines, but sometimes we have to make do with what we have.)
Edit: Attached another variation on the solution, this time only displaying the customer on the bottom since the product is described by the color.
- Mark as New
- Bookmark
- Subscribe
- Mute
- Subscribe to RSS Feed
- Permalink
- Report Inappropriate Content
Try changing the expression for products to:
=if(not isnull(Country),Product)
- Mark as New
- Bookmark
- Subscribe
- Mute
- Subscribe to RSS Feed
- Permalink
- Report Inappropriate Content
Nope, that didn't work.
It's not the country that's null, it's the product. I just tried it this way, =if(not isnull(Product),Product), but surely enough that didn't work either.
Thanks, though.
- Mark as New
- Bookmark
- Subscribe
- Mute
- Subscribe to RSS Feed
- Permalink
- Report Inappropriate Content
What about
=if(not isnull(Product),Country)
- Mark as New
- Bookmark
- Subscribe
- Mute
- Subscribe to RSS Feed
- Permalink
- Report Inappropriate Content
I can tell you without trying that that's not going to work. The bar lengths are determined by sum(Product), so "substituting the Country if Product is null" doesn't make any sense.
- Mark as New
- Bookmark
- Subscribe
- Mute
- Subscribe to RSS Feed
- Permalink
- Report Inappropriate Content
Marc, please note that every Product exists in at least one country.
- Mark as New
- Bookmark
- Subscribe
- Mute
- Subscribe to RSS Feed
- Permalink
- Report Inappropriate Content
Ok I think I understand.
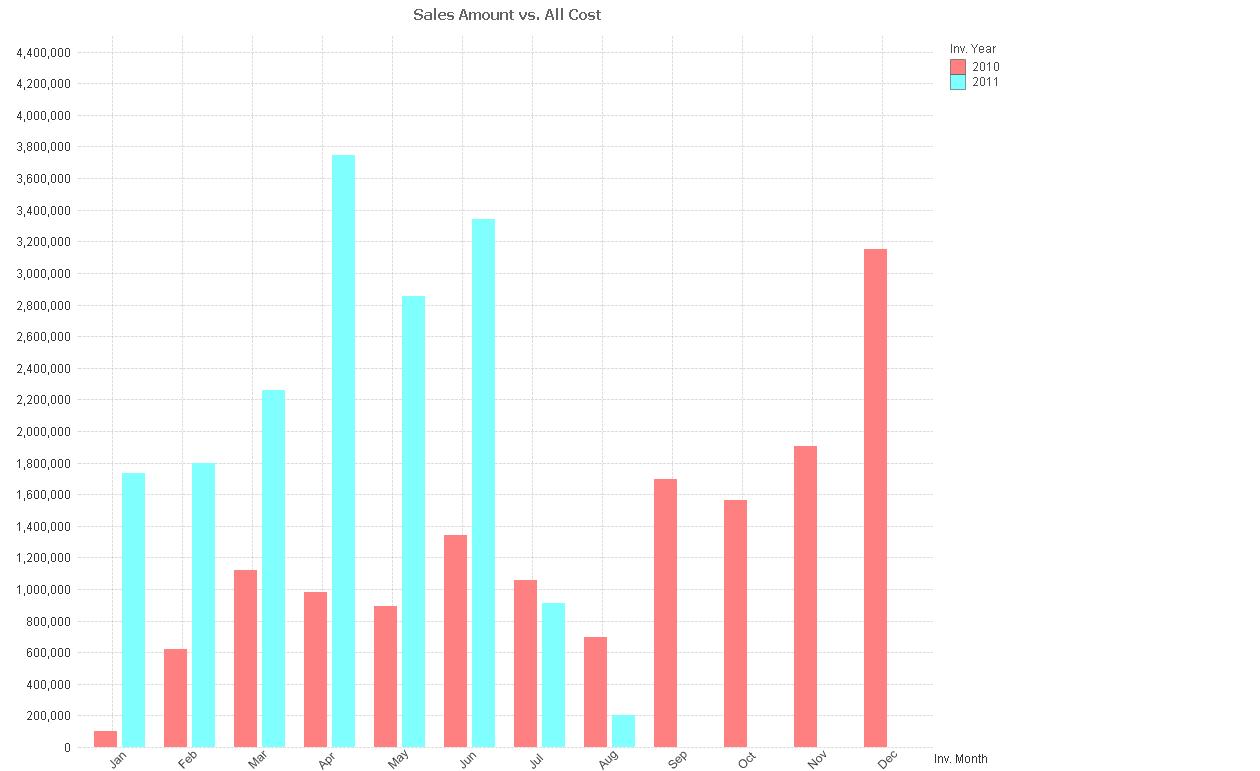
Example is I have 2 dimensions, year and month, and it is taking the sum of costs for each. After august shows blank because I have it as a grouped bar chart and sept on has not happened yet, but last year it did so it still shows the empty spot because the chart is looking at it as a 0 value. if both years had no cost in sept. it would not show at all.
Try making one dimension =Country & '-' & Product and see if it removes these blank sections
Edit: Ok my chart did not show up.
Message was edited by: marcsliving
- Mark as New
- Bookmark
- Subscribe
- Mute
- Subscribe to RSS Feed
- Permalink
- Report Inappropriate Content
Definitely, combining the two fields solve a problem, but creates a few new ones!
With that solution, i cannot group products by country and i cannot color-code the same product for different countries, because the identifier for each bar is now unique.
- Mark as New
- Bookmark
- Subscribe
- Mute
- Subscribe to RSS Feed
- Permalink
- Report Inappropriate Content
I'm not sure what you mean by not being able to group products by country. If country is first in your combination, and product is second, and you sort, then the products will be grouped by country. As for coloring the same product the same across different countries, you can handle that with a background color expression of some sort, like pick(match(Product,'A','B'),red(),blue()). Or as might be more easily maintained, load the RGB values for products in a table, and then use something like if(R,RGB(R,G,B)) as your background color expression. That still leaves new products with default colors. I wrote a script before that assigned random color values to missing dimension values, but I'm not finding the example. Ah, there it is. Attaching it.
Customer:
LOAD * INLINE [
Customer,R,G,B
A,200,100,100
B,100,200,100
C,100,100,200
];
OUTER JOIN (Customer)
LOAD text(fieldvalue('Customer',recno())) as Customer
AUTOGENERATE fieldvaluecount('Customer')
;
Customer2:
NOCONCATENATE
LOAD
Customer
,if(R,R,100+floor(rand()*101)) as R
,if(G,G,100+floor(rand()*101)) as G
,if(B,B,100+floor(rand()*101)) as B
RESIDENT Customer
;
DROP TABLE Customer
;
- Mark as New
- Bookmark
- Subscribe
- Mute
- Subscribe to RSS Feed
- Permalink
- Report Inappropriate Content
I see what you're getting at, but in your example, if I switch to grouped (rather than stacked) style then I still get the gaps when all of the possible products are showing. Stacked works, but I can't use it.
- « Previous Replies
-
- 1
- 2
- Next Replies »