Unlock a world of possibilities! Login now and discover the exclusive benefits awaiting you.
- Qlik Community
- :
- All Forums
- :
- QlikView App Dev
- :
- Re: line chart
Options
- Subscribe to RSS Feed
- Mark Topic as New
- Mark Topic as Read
- Float this Topic for Current User
- Bookmark
- Subscribe
- Mute
- Printer Friendly Page
Turn on suggestions
Auto-suggest helps you quickly narrow down your search results by suggesting possible matches as you type.
Showing results for
Anonymous
Not applicable
2017-11-25
06:32 AM
- Mark as New
- Bookmark
- Subscribe
- Mute
- Subscribe to RSS Feed
- Permalink
- Report Inappropriate Content
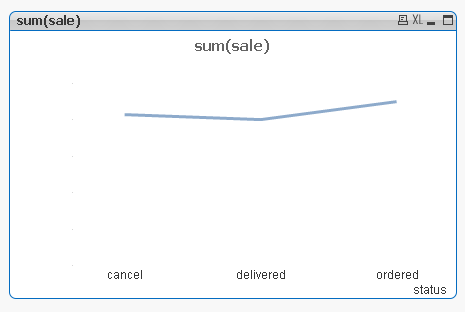
line chart
hello everyone
i have created line chart but its not showing y axis.
help me to find out.
527 Views
6 Replies
2017-11-25
06:34 AM
- Mark as New
- Bookmark
- Subscribe
- Mute
- Subscribe to RSS Feed
- Permalink
- Report Inappropriate Content
May be you doesn't have values on that, And looks like your expression not full filled. As always come with some sample example
Best Anil, When applicable please mark the correct/appropriate replies as "solution" (you can mark up to 3 "solutions". Please LIKE threads if the provided solution is helpful
426 Views
Anonymous
Not applicable
2017-11-25
06:59 AM
Author
- Mark as New
- Bookmark
- Subscribe
- Mute
- Subscribe to RSS Feed
- Permalink
- Report Inappropriate Content
it shows 
426 Views
2017-11-25
08:43 AM
- Mark as New
- Bookmark
- Subscribe
- Mute
- Subscribe to RSS Feed
- Permalink
- Report Inappropriate Content
May be helps Qlik Community Tip: How to Get Answers to Your Post
Best Anil, When applicable please mark the correct/appropriate replies as "solution" (you can mark up to 3 "solutions". Please LIKE threads if the provided solution is helpful
Master
2017-11-26
04:16 AM
- Mark as New
- Bookmark
- Subscribe
- Mute
- Subscribe to RSS Feed
- Permalink
- Report Inappropriate Content
can you share sample code or qvw
426 Views
Partner - Creator
2017-11-26
11:30 PM
- Mark as New
- Bookmark
- Subscribe
- Mute
- Subscribe to RSS Feed
- Permalink
- Report Inappropriate Content
Hi ,
find attached screenshot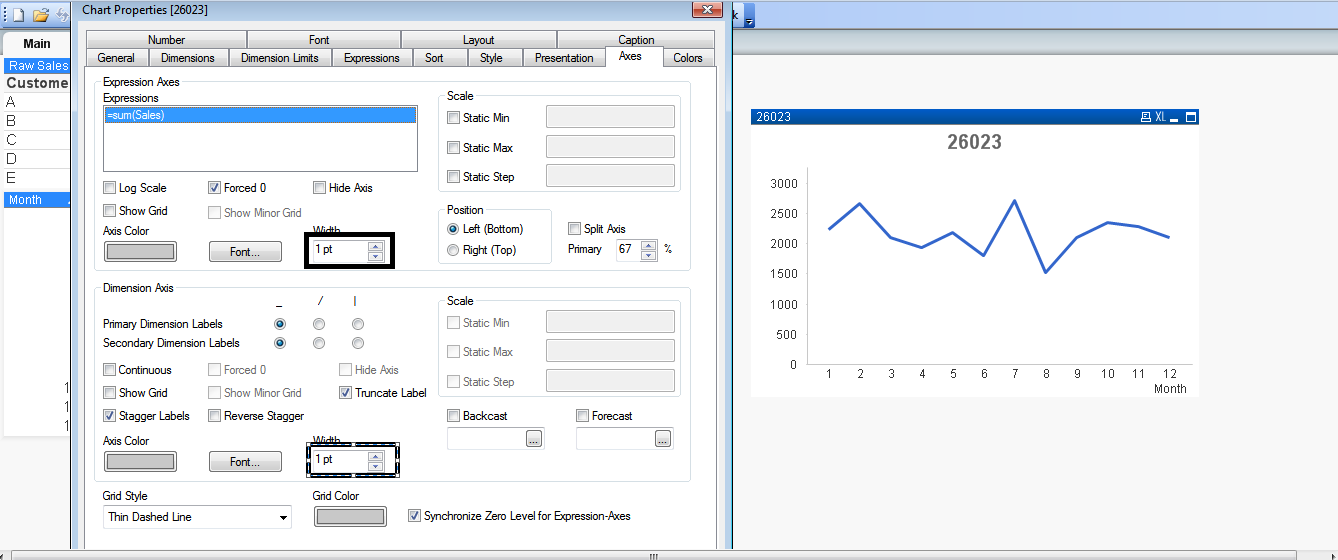
426 Views
Partner - Creator
2017-11-26
11:38 PM
- Mark as New
- Bookmark
- Subscribe
- Mute
- Subscribe to RSS Feed
- Permalink
- Report Inappropriate Content
and also try this, uncheck hide Axis option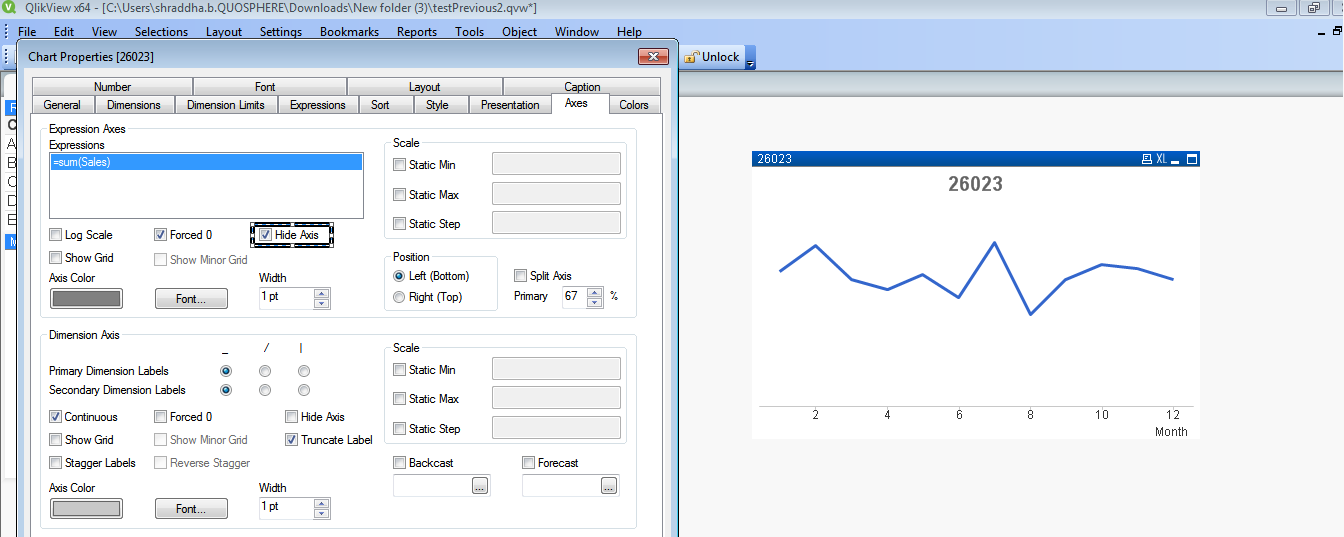
426 Views