Unlock a world of possibilities! Login now and discover the exclusive benefits awaiting you.
- Qlik Community
- :
- Forums
- :
- Analytics
- :
- New to Qlik Analytics
- :
- Missing data when Pivot table
- Subscribe to RSS Feed
- Mark Topic as New
- Mark Topic as Read
- Float this Topic for Current User
- Bookmark
- Subscribe
- Mute
- Printer Friendly Page
- Mark as New
- Bookmark
- Subscribe
- Mute
- Subscribe to RSS Feed
- Permalink
- Report Inappropriate Content
Missing data when Pivot table
Hi, I have this problem:
In my excel, project breakdown sheet. There are 37 projects. Its fine. The problem is when I do the pivot table for Incident (LOPC,SPILL, MINOR FIRE, MAJOR FIRE, MINOR PD, MAJOR PD, FAC, MTC,RWC )named Incident Type. The project from 37 become 6 only. It only take project that has incident. I want all the project so that I can create the selection but now only has 6 project.
Hope you guys can help me 
- Tags:
- pivotal table
Accepted Solutions
- Mark as New
- Bookmark
- Subscribe
- Mute
- Subscribe to RSS Feed
- Permalink
- Report Inappropriate Content
alter your script as follow:
Set dataManagerTables = '','Projects Breakdown';
//This block renames script tables from non generated section which conflict with the names of managed tables
For each name in $(dataManagerTables)
Let index = 0;
Let currentName = name;
Let tableNumber = TableNumber(name);
Let matches = 0;
Do while not IsNull(tableNumber) or (index > 0 and matches > 0)
index = index + 1;
currentName = name & '-' & index;
tableNumber = TableNumber(currentName)
matches = Match('$(currentName)', $(dataManagerTables));
Loop
If index > 0 then
Rename Table [$(name)] to [$(currentName)];
EndIf;
Next;
__cityAliasesBase:
LOAD
Alias AS [__City],
geoKey AS [__geoKey],
CountryCode AS [__CityCountryCode]
FROM [lib://__GEO_TABLES/cityAliases.qvd]
(qvd);
__cityGeoBase:
LOAD
geoKey AS [__geoKey],
geoPoint AS [__GeoPoint]
FROM [lib://__GEO_TABLES/cityGeo.qvd]
(qvd);
__cityName2Key:
MAPPING LOAD
__City,
__geoKey
RESIDENT __cityAliasesBase;
__cityKey2GeoPoint:
MAPPING LOAD
__geoKey,
__GeoPoint
RESIDENT __cityGeoBase;
[Projects Breakdown]:
LOAD
[No],
[Date],
[Region],
[Project],
[Project/Location],
[Focal Person],
[Latitude],
[Longitude],
[LOPC],
[Spill],
[NM],
[HiPo NM],
[Minor Fire],
[Major Fire],
[Minor PD],
[Major PD],
[FAC],
[MTC],
[RWC],
[LWC],
[PPD],
[PTD],
[Fatality],
[Manhours Com/On],
[Manhours Com/Off],
[Manhours Con/On],
[Manhours Con/Off],
[Manhours Total (Month)],
[Manhours YTD 217],
[UAUC Com/On],
[UAUC Com/Off],
[UAUC Con/On],
[UAUC Con/Off],
[UAUC Total (Month)],
[UAUC YTD 217],
[UAUC Ratio (Month)],
[UAUC Ratio (YTD)],
[Zeto Total (Month)],
[Zeto YTD 217],
[Consequence Total (Month)],
[Consequence YTD 217],
[Stop Work Total (Month)],
[Stop Work YTD 217],
APPLYMAP( '__cityKey2GeoPoint', APPLYMAP( '__cityName2Key', LOWER([Region])), '-') AS [Projects Breakdown.Region_GeoInfo],
GeoMakePoint([Latitude], [Longitude]) AS [Longitude_Latitude]
FROM [lib://Desktop/Upstream projects breakdown_Sept20171.xlsx]
(ooxml, embedded labels, header is 1 lines, table is [Projects Breakdown]);
TAG FIELD [Region] WITH '$geoname', '$relates_Projects Breakdown.Region_GeoInfo' ;
TAG FIELD [Projects Breakdown.Region_GeoInfo] WITH '$geopoint', '$hidden', '$relates_Region' ;
DROP TABLES __cityAliasesBase, __cityGeoBase;
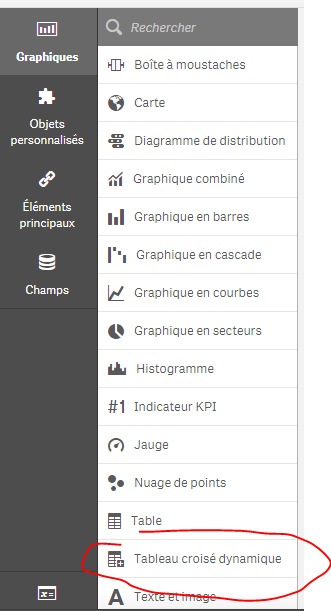
then to build a pivot table; just use this :
please refer to this:
- Mark as New
- Bookmark
- Subscribe
- Mute
- Subscribe to RSS Feed
- Permalink
- Report Inappropriate Content
Please try this.
Thank You.
- Mark as New
- Bookmark
- Subscribe
- Mute
- Subscribe to RSS Feed
- Permalink
- Report Inappropriate Content
why are you doing a crosstable?
- Mark as New
- Bookmark
- Subscribe
- Mute
- Subscribe to RSS Feed
- Permalink
- Report Inappropriate Content
What you meant by crosstable? I'm new in Qlik Sense and what I know if we want to pivot, we just go to data manager and do the pivot thing. Can you show me the right way?
- Mark as New
- Bookmark
- Subscribe
- Mute
- Subscribe to RSS Feed
- Permalink
- Report Inappropriate Content
alter your script as follow:
Set dataManagerTables = '','Projects Breakdown';
//This block renames script tables from non generated section which conflict with the names of managed tables
For each name in $(dataManagerTables)
Let index = 0;
Let currentName = name;
Let tableNumber = TableNumber(name);
Let matches = 0;
Do while not IsNull(tableNumber) or (index > 0 and matches > 0)
index = index + 1;
currentName = name & '-' & index;
tableNumber = TableNumber(currentName)
matches = Match('$(currentName)', $(dataManagerTables));
Loop
If index > 0 then
Rename Table [$(name)] to [$(currentName)];
EndIf;
Next;
__cityAliasesBase:
LOAD
Alias AS [__City],
geoKey AS [__geoKey],
CountryCode AS [__CityCountryCode]
FROM [lib://__GEO_TABLES/cityAliases.qvd]
(qvd);
__cityGeoBase:
LOAD
geoKey AS [__geoKey],
geoPoint AS [__GeoPoint]
FROM [lib://__GEO_TABLES/cityGeo.qvd]
(qvd);
__cityName2Key:
MAPPING LOAD
__City,
__geoKey
RESIDENT __cityAliasesBase;
__cityKey2GeoPoint:
MAPPING LOAD
__geoKey,
__GeoPoint
RESIDENT __cityGeoBase;
[Projects Breakdown]:
LOAD
[No],
[Date],
[Region],
[Project],
[Project/Location],
[Focal Person],
[Latitude],
[Longitude],
[LOPC],
[Spill],
[NM],
[HiPo NM],
[Minor Fire],
[Major Fire],
[Minor PD],
[Major PD],
[FAC],
[MTC],
[RWC],
[LWC],
[PPD],
[PTD],
[Fatality],
[Manhours Com/On],
[Manhours Com/Off],
[Manhours Con/On],
[Manhours Con/Off],
[Manhours Total (Month)],
[Manhours YTD 217],
[UAUC Com/On],
[UAUC Com/Off],
[UAUC Con/On],
[UAUC Con/Off],
[UAUC Total (Month)],
[UAUC YTD 217],
[UAUC Ratio (Month)],
[UAUC Ratio (YTD)],
[Zeto Total (Month)],
[Zeto YTD 217],
[Consequence Total (Month)],
[Consequence YTD 217],
[Stop Work Total (Month)],
[Stop Work YTD 217],
APPLYMAP( '__cityKey2GeoPoint', APPLYMAP( '__cityName2Key', LOWER([Region])), '-') AS [Projects Breakdown.Region_GeoInfo],
GeoMakePoint([Latitude], [Longitude]) AS [Longitude_Latitude]
FROM [lib://Desktop/Upstream projects breakdown_Sept20171.xlsx]
(ooxml, embedded labels, header is 1 lines, table is [Projects Breakdown]);
TAG FIELD [Region] WITH '$geoname', '$relates_Projects Breakdown.Region_GeoInfo' ;
TAG FIELD [Projects Breakdown.Region_GeoInfo] WITH '$geopoint', '$hidden', '$relates_Region' ;
DROP TABLES __cityAliasesBase, __cityGeoBase;
then to build a pivot table; just use this :
please refer to this:
- Mark as New
- Bookmark
- Subscribe
- Mute
- Subscribe to RSS Feed
- Permalink
- Report Inappropriate Content
It works but i want to share it as chart not table. How can I do that?
- Mark as New
- Bookmark
- Subscribe
- Mute
- Subscribe to RSS Feed
- Permalink
- Report Inappropriate Content
Hi Thank you so much but can i show that as bar chart?