Unlock a world of possibilities! Login now and discover the exclusive benefits awaiting you.
- Qlik Community
- :
- Forums
- :
- Analytics
- :
- New to Qlik Analytics
- :
- how to show missing data in a table
- Subscribe to RSS Feed
- Mark Topic as New
- Mark Topic as Read
- Float this Topic for Current User
- Bookmark
- Subscribe
- Mute
- Printer Friendly Page
- Mark as New
- Bookmark
- Subscribe
- Mute
- Subscribe to RSS Feed
- Permalink
- Report Inappropriate Content
how to show missing data in a table
I need to show a visiting report.
The data includes:
customer name
project name
visiter
date of visit
I made a pivot table chart with the dimension:
customer name, project name, week (from date)
the expression is "count (date)" - in order to count how many visits were there at each project in each week.
Only I want to see not only the project that were visited, but the projects with no visits at that week.
How do I do that?
- Tags:
- pivot table
Accepted Solutions
- Mark as New
- Bookmark
- Subscribe
- Mute
- Subscribe to RSS Feed
- Permalink
- Report Inappropriate Content
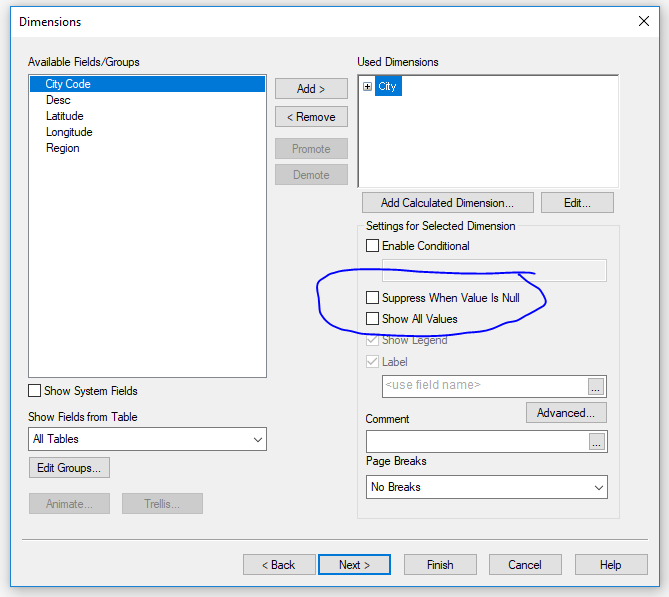
Any way you can share the app?
What about messing around with these options here on properties.
- Mark as New
- Bookmark
- Subscribe
- Mute
- Subscribe to RSS Feed
- Permalink
- Report Inappropriate Content
you can untick "Suppress Zero-Values" under Presentation.
In this way you can see even rows with 0 as expression, therefore all projects with no visits.
- Mark as New
- Bookmark
- Subscribe
- Mute
- Subscribe to RSS Feed
- Permalink
- Report Inappropriate Content
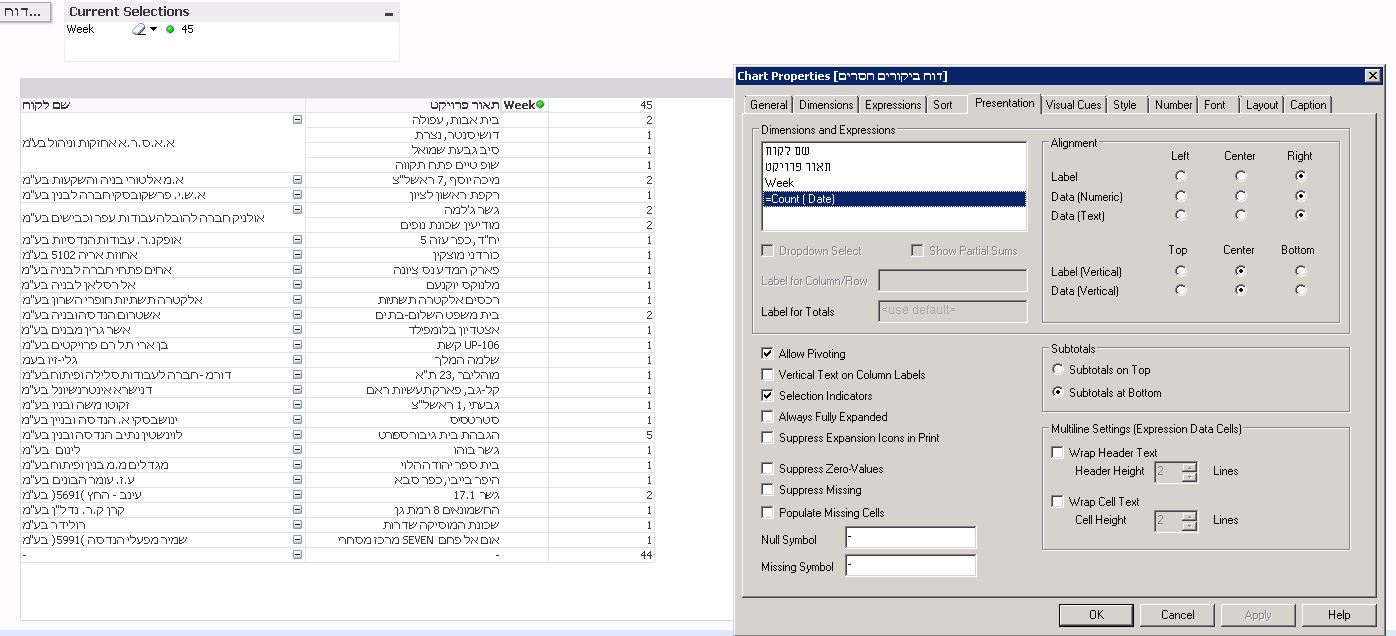
Thank you Andrea, how ever it didnot work.
Please see a copy of the result:
- Mark as New
- Bookmark
- Subscribe
- Mute
- Subscribe to RSS Feed
- Permalink
- Report Inappropriate Content
You have ticked it for the Count value. Are you sure it's not based on one of the dimensions it is suppressing values?
- Mark as New
- Bookmark
- Subscribe
- Mute
- Subscribe to RSS Feed
- Permalink
- Report Inappropriate Content
I think you should use something as Count(DISTINCT Visiter) instead of Count(Date) as your expression in pivot table.
- Mark as New
- Bookmark
- Subscribe
- Mute
- Subscribe to RSS Feed
- Permalink
- Report Inappropriate Content
None of the dimntsions is clicked as suppressing values...
- Mark as New
- Bookmark
- Subscribe
- Mute
- Subscribe to RSS Feed
- Permalink
- Report Inappropriate Content
Any way you can share the app?
What about messing around with these options here on properties.
- Mark as New
- Bookmark
- Subscribe
- Mute
- Subscribe to RSS Feed
- Permalink
- Report Inappropriate Content
Yes!
I still need to "play" with it.
But it does give much more options.
Thank you 
- Mark as New
- Bookmark
- Subscribe
- Mute
- Subscribe to RSS Feed
- Permalink
- Report Inappropriate Content
Glad to hear. You are welcome