Unlock a world of possibilities! Login now and discover the exclusive benefits awaiting you.
- Qlik Community
- :
- Forums
- :
- Analytics
- :
- New to Qlik Analytics
- :
- Re: How can we import Images in SVG Reader??
- Subscribe to RSS Feed
- Mark Topic as New
- Mark Topic as Read
- Float this Topic for Current User
- Bookmark
- Subscribe
- Mute
- Printer Friendly Page
- Mark as New
- Bookmark
- Subscribe
- Mute
- Subscribe to RSS Feed
- Permalink
- Report Inappropriate Content
SVG READER
Hi All,
I have installed SVG reader Extension in my Qliksense Server. I have create a Human Body Image through Inkspace.
Can anyone help me how can I import this image to the SVG reader?
Thanks
Juna
- Mark as New
- Bookmark
- Subscribe
- Mute
- Subscribe to RSS Feed
- Permalink
- Report Inappropriate Content
Hi Aehman,
Could you please check if this extension works for you? Does not work for me.
This is the only solution so
- Mark as New
- Bookmark
- Subscribe
- Mute
- Subscribe to RSS Feed
- Permalink
- Report Inappropriate Content
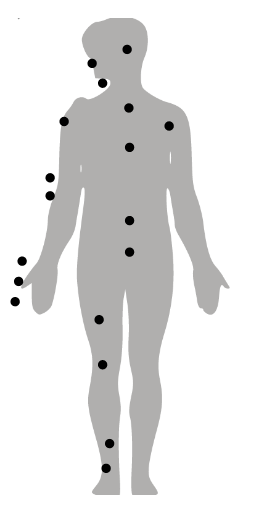
I'm able to insert an image in above extension but not sure how to plot points specifically on the human body.
https://community.qlik.com/servlet/JiveServlet/downloadImage/2-1390023-184802/Body+Graph.png
Paste the above link in the URL option for the extension
It is a unique requirement from your client which seem nearly impossible to do just by using extension/qlik sense.
You may need HTML or Java to embed this image and find the axis where the points are suppose to be.
Image can be plotted but showing correct data points on human body is hard unless you define correct X & Y axis.
Maybe an expert on this can help you, who has skills in html & java.
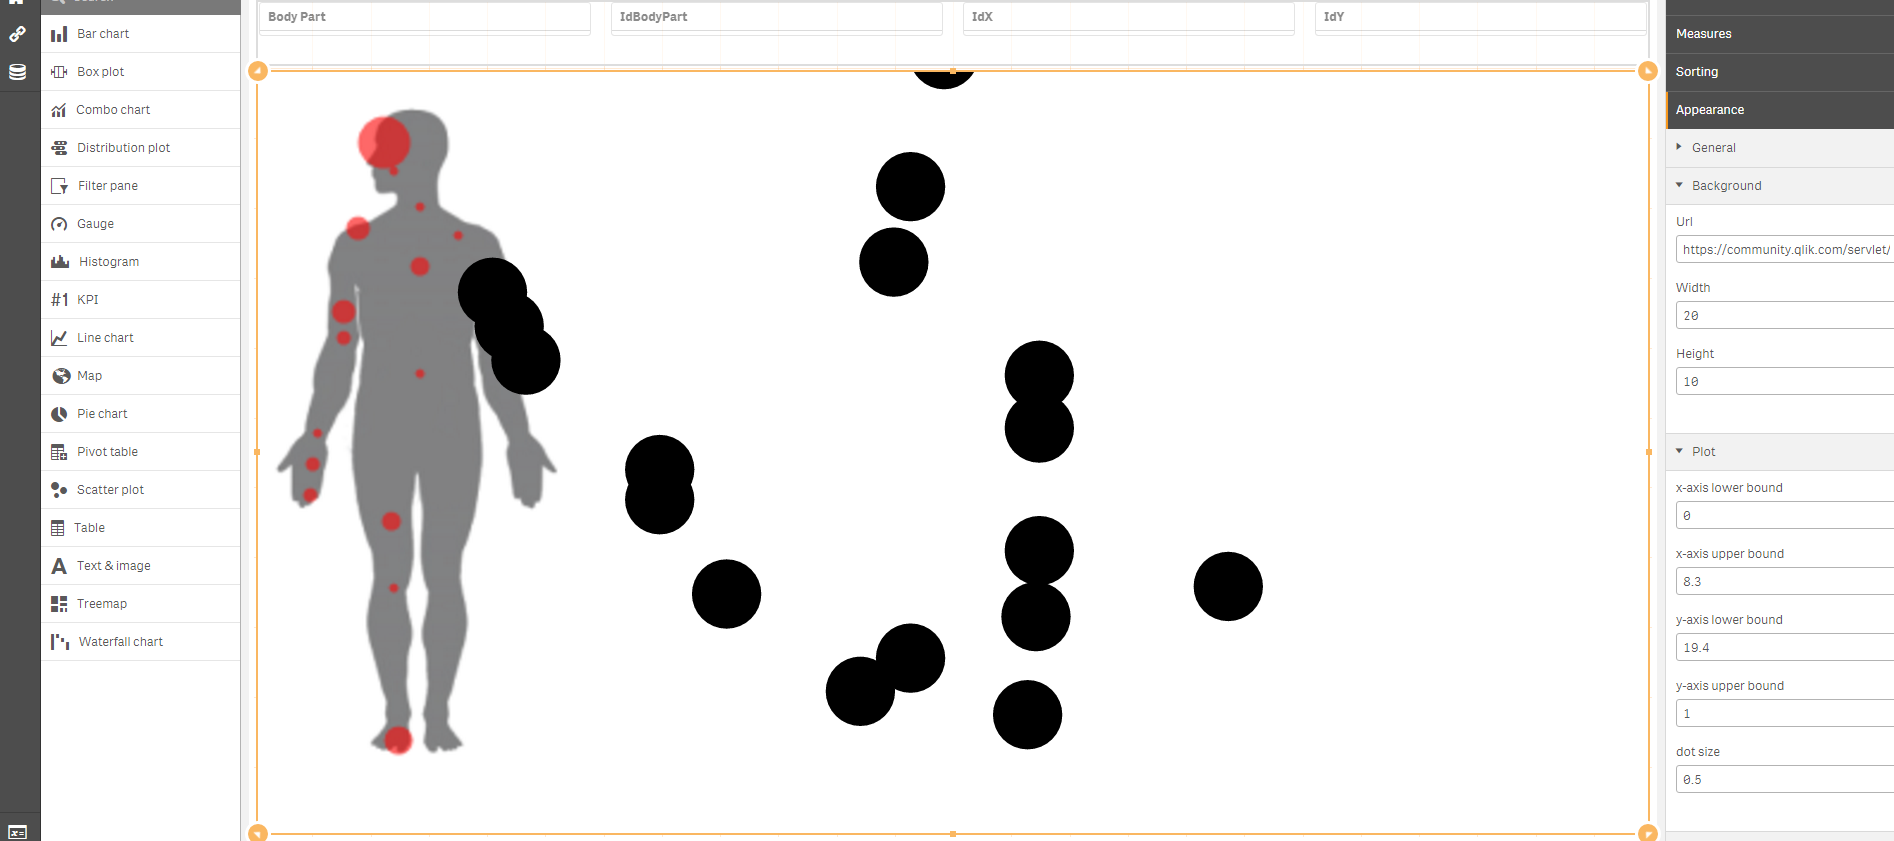
BTW, I may able to plot the points on that body but we may need to gt rid of those red dots so that we can plot our own dots....
As in a plain image
After tweaking the axis, image height and width I got below image....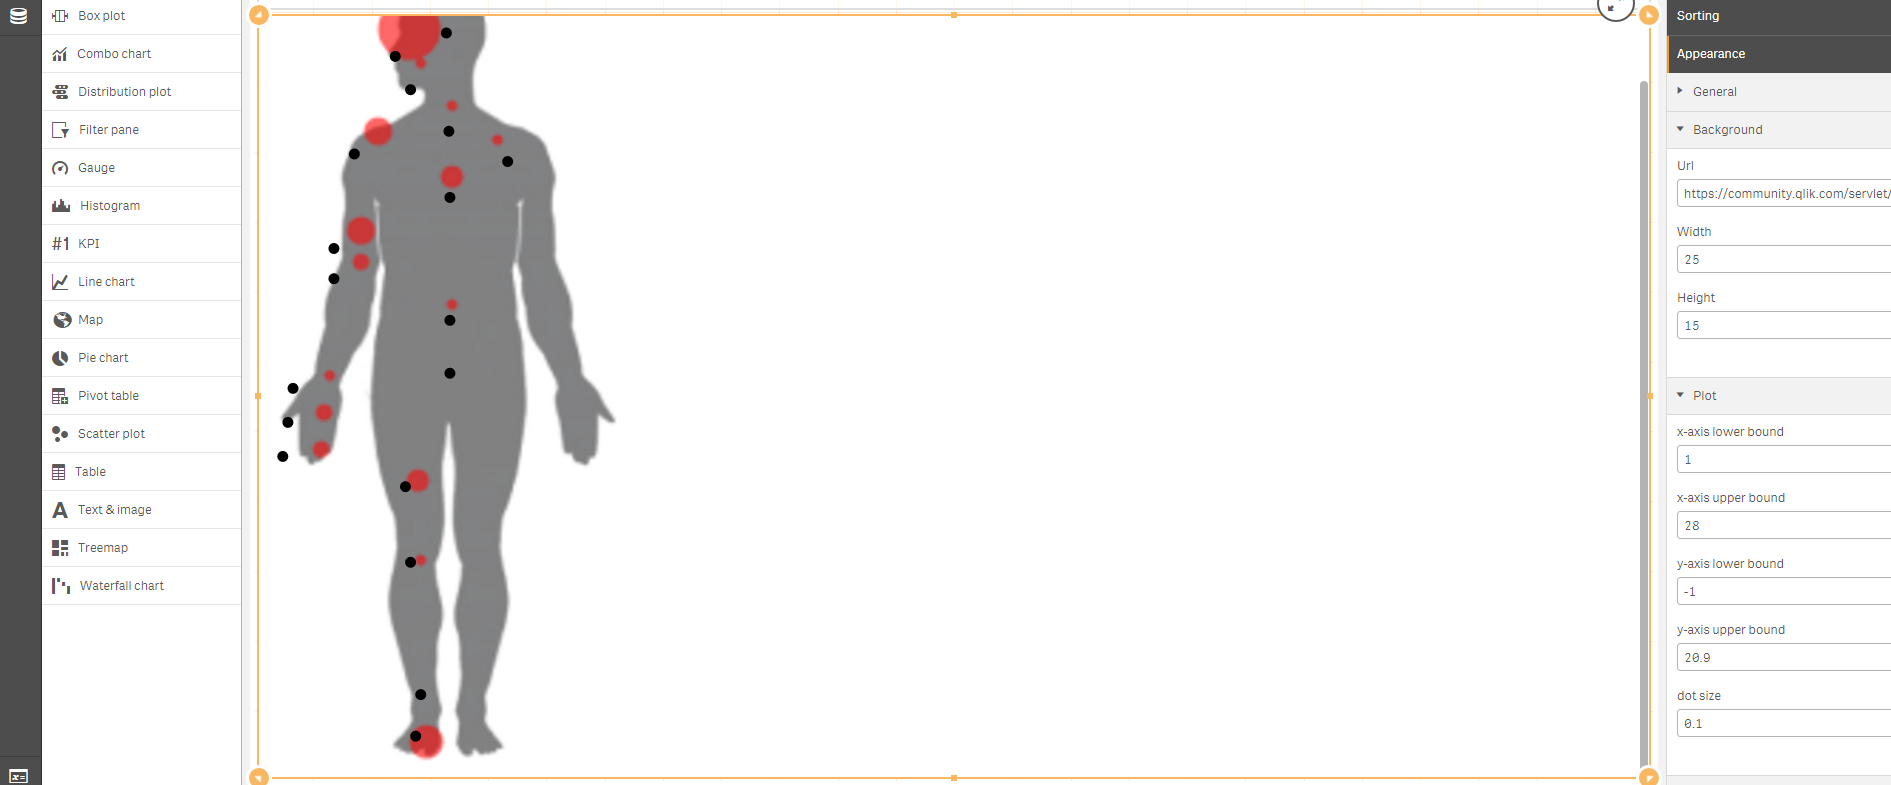
- Mark as New
- Bookmark
- Subscribe
- Mute
- Subscribe to RSS Feed
- Permalink
- Report Inappropriate Content
Use the below attached file as a test...
You'd need to do the following
A. Plain image of human boy with no red dots (so that you can plot black dots which won't confuse users)
2. Upload the plain human body image on some URL which should stay for longer period of times or upload it on your google drive and paste that link in URL for extension.
3. Adjust the X and Y axis (values in - can also be given, like -1 or -20 etc...)
4. Maybe color code if required to show different points? (did not try by myself)
- Mark as New
- Bookmark
- Subscribe
- Mute
- Subscribe to RSS Feed
- Permalink
- Report Inappropriate Content
Google drive is restricted at my work. How can I upload my image?
- Mark as New
- Bookmark
- Subscribe
- Mute
- Subscribe to RSS Feed
- Permalink
- Report Inappropriate Content
Use any free website where you can upload the image or if you've sharepoint at work then ask someone who has access to it upload it for you?
Or you can upload your plain image on qlik community and right click on it>'Copy Image Address'
This needs to be done only cus you do not want image to be deleted automatically from website as it would automatically make your URL not work in Qlik Sense.
To color code use HEX code not RGB or ARGB.
Ex:
if(YOUREXPRESSION, '#f00', '#00f')
- Mark as New
- Bookmark
- Subscribe
- Mute
- Subscribe to RSS Feed
- Permalink
- Report Inappropriate Content
Adding Image Here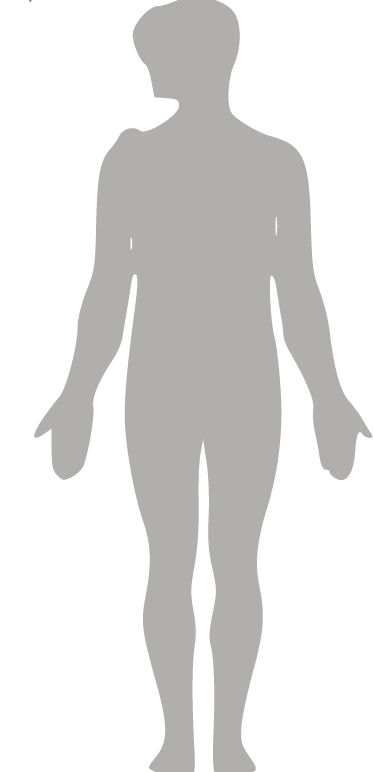
- Mark as New
- Bookmark
- Subscribe
- Mute
- Subscribe to RSS Feed
- Permalink
- Report Inappropriate Content
You can try using the above image compare the pixel size for both the images, red dots and plain so that the data points are plotted correctly, I'll try to test it tomorrow.....
Off for the day, good luck.
- Mark as New
- Bookmark
- Subscribe
- Mute
- Subscribe to RSS Feed
- Permalink
- Report Inappropriate Content
Ok ...Thank you.
- Mark as New
- Bookmark
- Subscribe
- Mute
- Subscribe to RSS Feed
- Permalink
- Report Inappropriate Content
I did this in server.The only issue is the bubble size is consistent.It should change the higher value of measure. Also I do not see a place to change the color itself.
- Mark as New
- Bookmark
- Subscribe
- Mute
- Subscribe to RSS Feed
- Permalink
- Report Inappropriate Content
I think we need to add a third measure for bubble size which is the sum of accidents. I checked the description given Human Body Parts Threads.