Unlock a world of possibilities! Login now and discover the exclusive benefits awaiting you.
- Qlik Community
- :
- All Forums
- :
- QlikView App Dev
- :
- Stacked bar chart which sums up to 100 %
- Subscribe to RSS Feed
- Mark Topic as New
- Mark Topic as Read
- Float this Topic for Current User
- Bookmark
- Subscribe
- Mute
- Printer Friendly Page
- Mark as New
- Bookmark
- Subscribe
- Mute
- Subscribe to RSS Feed
- Permalink
- Report Inappropriate Content
Stacked bar chart which sums up to 100 %
Hello Everyone,
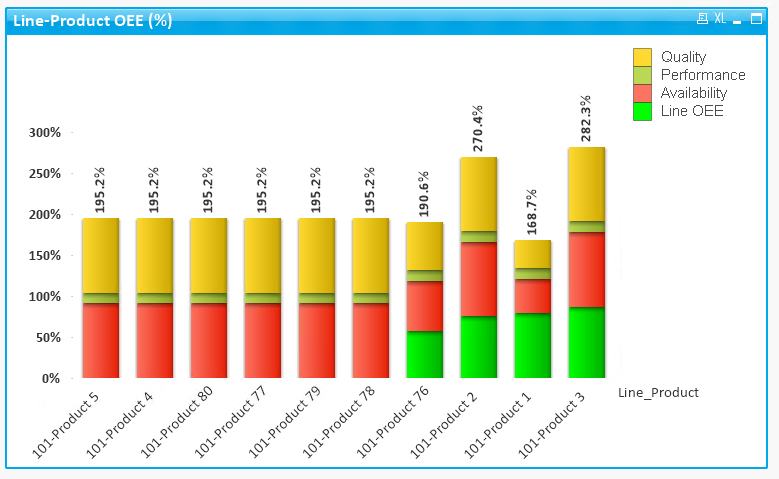
I have a requirement in which I have to create a stacked bar chart in which all the expressions should sum up to 100 %. I have four expressions and one dimension. When I choose one dimension value I get total as 100 % but if I leave it as it is, values are unrealistic as shown in below pictures.

Also checked on community and found a solution which says, expression to be like: sum(Expression)/sum(TOTAL <Dimension> Expression). But my expression is a little complex and has the function "sum" in it already, so I cannot use "sum" again. One of the expression is as shown below:
if(F1='ONLine',(sum({$<Station={"BMM"}>}[Total Pieces Produced]/[Max pc/hr])/sum({$<Station={"BMM"}>}"Operating Time
*(1-(sum([Scrapped Pieces])/sum({$<Station={"BMM"}>}[Total Pieces Produced]))),
if(F1='OFFLine',(sum({$<F1={"OFFLine"}>}"Operating Time
*sum({$<F1={"OFFLine"}>}"Planned Prod. Time
*
(sum({$<F1={"OFFLine"}>}[Total Pieces Produced]/[Max pc/hr])/sum({$<F1={"OFFLine"}>}"Operating Time
*sum({$<F1={"OFFLine"}>}"Operating Time
*
(sum({$<F1={"OFFLine"}>}[Total Pieces Produced]-[Scrapped Pieces])/sum({$<F1={"OFFLine"}>}[Total Pieces Produced])
*sum({$<F1={"OFFLine"}>}[Total Pieces Produced])/sum({$<Station={"BMM","Assembly","Welding"},Product=, F1={"OFFLine"}>}[Total Pieces Produced]))))
How do I get this to work?
Any suggestions?
Thank you.
- « Previous Replies
- Next Replies »
Accepted Solutions
- Mark as New
- Bookmark
- Subscribe
- Mute
- Subscribe to RSS Feed
- Permalink
- Report Inappropriate Content
I think what you need is this
Expression1 / RangeSum(Expression1, Expression2, Expression3, Expression4)
Expression2 / RangeSum(Expression1, Expression2, Expression3, Expression4)
Expression3 / RangeSum(Expression1, Expression2, Expression3, Expression4)
Expression4 / RangeSum(Expression1, Expression2, Expression3, Expression4)
- Mark as New
- Bookmark
- Subscribe
- Mute
- Subscribe to RSS Feed
- Permalink
- Report Inappropriate Content
Basically replace Expression1, Expression2, Expression3, Expression4 with there original expressions, or you can create variables and use them instead of the whole expression multiple times 
- Mark as New
- Bookmark
- Subscribe
- Mute
- Subscribe to RSS Feed
- Permalink
- Report Inappropriate Content
Hi Sunny,
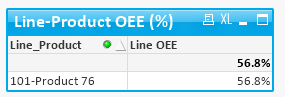
Thanks a lot for the response. I am close to the solution after trying your suggestion. Though the bars sum up to 100% there is a small difference in the values that I see in the chart. As you can see in the below screenshots, values that I see when a particular dimension is selected on the x - axis is what I would like to see when there is no selection made in the dimension as well.
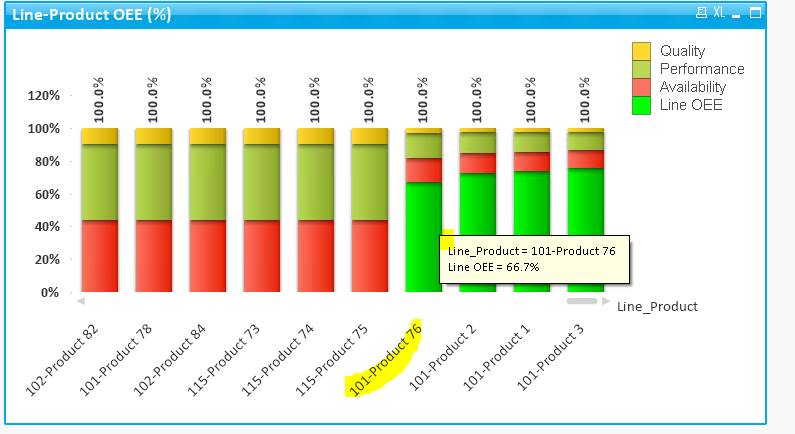
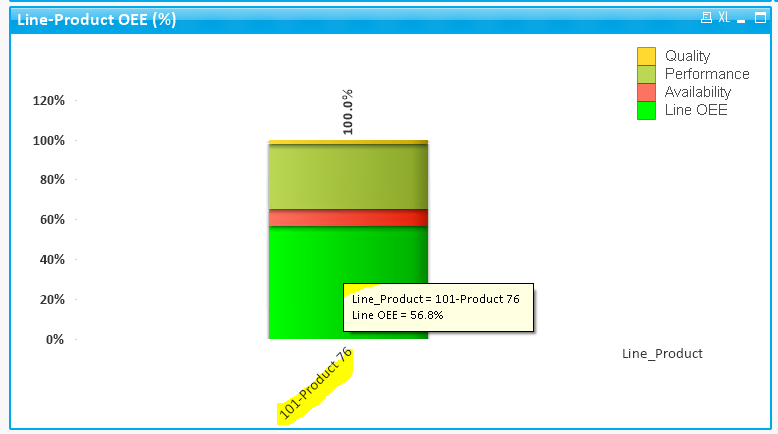
So the expected value for Line OEE when no dimension is selected should also show "56.8%" and not "66.7%".
Any idea, what I can check for to make this work?
Thank you.
- Mark as New
- Bookmark
- Subscribe
- Mute
- Subscribe to RSS Feed
- Permalink
- Report Inappropriate Content
This seems like an issue with your expression... create a straight table with just the expression for that segment of the bar and see it's value with and without selection in Line_Product... I am 100% sure that it's value will change... which might be causing the % to change.....
- Mark as New
- Bookmark
- Subscribe
- Mute
- Subscribe to RSS Feed
- Permalink
- Report Inappropriate Content
Hi Sunny,
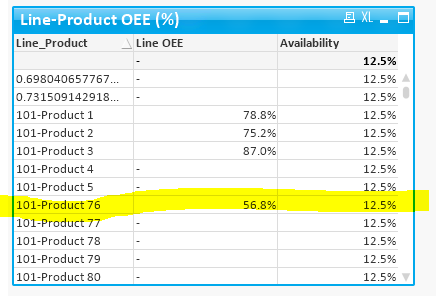
Did you mean like this?
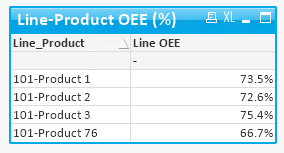
Yes, it changes in the straight table also. And this not just with Line OEE, even other expressions (Availability, Performance and Quality) also have different values when there is a selection made in the dimension. I will have a look into the expression and in the mean time if you find anything please let me know. I will try to attach a sample soon.
Thank you.
- Mark as New
- Bookmark
- Subscribe
- Mute
- Subscribe to RSS Feed
- Permalink
- Report Inappropriate Content
Do not carry out the division... just the straight expression without division with the 4 expressions....
- Mark as New
- Bookmark
- Subscribe
- Mute
- Subscribe to RSS Feed
- Permalink
- Report Inappropriate Content
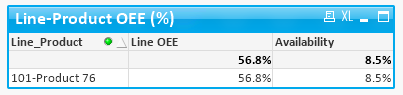
Hi Sunny,
Without doing the division, values remain the same for Line OEE but they change in other expressions (like, Availability here). So I think I have to check those formulas. Or is there any thing else that is causing this issue?
Thank you.
- Mark as New
- Bookmark
- Subscribe
- Mute
- Subscribe to RSS Feed
- Permalink
- Report Inappropriate Content
Yup, you got it... one of those values are changing when you make the selection, which is causing the percentage to change.... If I may ask, why are we seeing 12.5% across all Line_Product for availability when no selection is made? Are you using TOTAL in your expression?
- Mark as New
- Bookmark
- Subscribe
- Mute
- Subscribe to RSS Feed
- Permalink
- Report Inappropriate Content
Hmm, yes I am using TOTAL in the expression. The expression actually is a little complex and I have stored in a variable.
So Availability here is = ($(vRateAvailability)*$(vRatePlantOEE))/$(vTotalRate)
These variables in turn contain another variable which then has an expression in it, and in this expression I am using "TOTAL".
For example, variable, $(vRateAvailability) is =(100&'%'-num($(vAvailability),'#,##0.0%'))
$(vAvailability) =
(sum(aggr(if(F1='ONLine',sum({$<F1={"ONLine"},Station={"BMM"}>}"Operating Time
if(F1='OFFLine',aggr(sum({$<F1={"OFFLine"}>}"Operating Time
*sum({$<F1={"OFFLine"}>}"Planned Prod. Time
)),F1)*aggr(sum({$<Station={"BMM"}>}"Planned Prod. Time
May be that is the reason for this issue.
- « Previous Replies
- Next Replies »