Unlock a world of possibilities! Login now and discover the exclusive benefits awaiting you.
- Qlik Community
- :
- All Forums
- :
- QlikView App Dev
- :
- Re: Stacked bar chart which sums up to 100 %
- Subscribe to RSS Feed
- Mark Topic as New
- Mark Topic as Read
- Float this Topic for Current User
- Bookmark
- Subscribe
- Mute
- Printer Friendly Page
- Mark as New
- Bookmark
- Subscribe
- Mute
- Subscribe to RSS Feed
- Permalink
- Report Inappropriate Content
Stacked bar chart which sums up to 100 %
Hello Everyone,
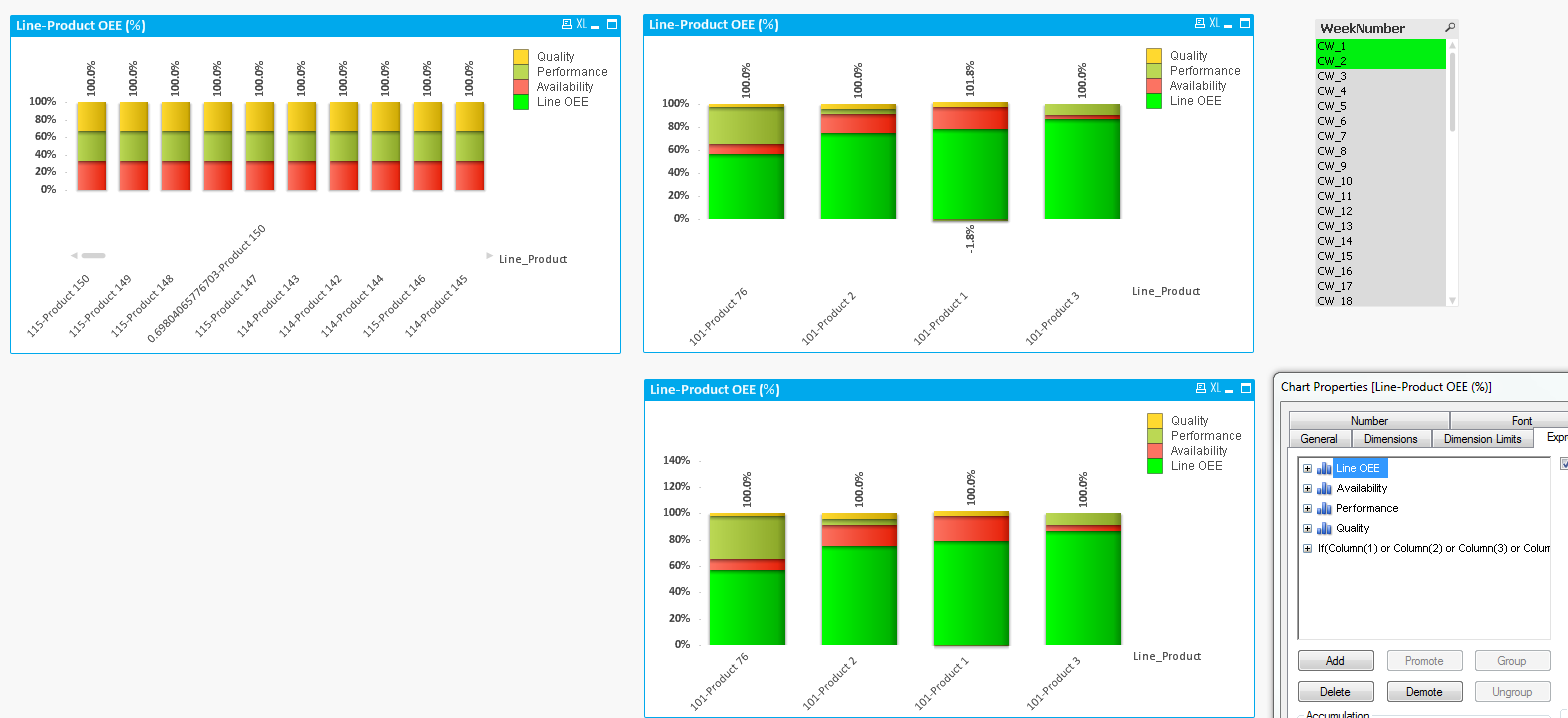
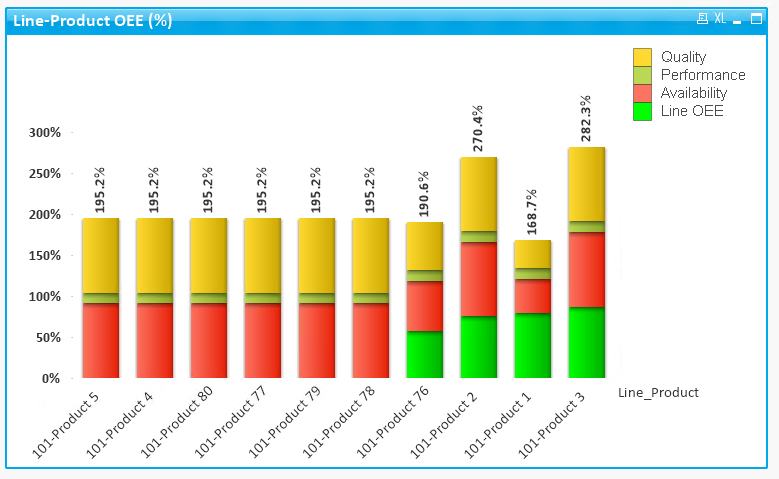
I have a requirement in which I have to create a stacked bar chart in which all the expressions should sum up to 100 %. I have four expressions and one dimension. When I choose one dimension value I get total as 100 % but if I leave it as it is, values are unrealistic as shown in below pictures.

Also checked on community and found a solution which says, expression to be like: sum(Expression)/sum(TOTAL <Dimension> Expression). But my expression is a little complex and has the function "sum" in it already, so I cannot use "sum" again. One of the expression is as shown below:
if(F1='ONLine',(sum({$<Station={"BMM"}>}[Total Pieces Produced]/[Max pc/hr])/sum({$<Station={"BMM"}>}"Operating Time
*(1-(sum([Scrapped Pieces])/sum({$<Station={"BMM"}>}[Total Pieces Produced]))),
if(F1='OFFLine',(sum({$<F1={"OFFLine"}>}"Operating Time
*sum({$<F1={"OFFLine"}>}"Planned Prod. Time
*
(sum({$<F1={"OFFLine"}>}[Total Pieces Produced]/[Max pc/hr])/sum({$<F1={"OFFLine"}>}"Operating Time
*sum({$<F1={"OFFLine"}>}"Operating Time
*
(sum({$<F1={"OFFLine"}>}[Total Pieces Produced]-[Scrapped Pieces])/sum({$<F1={"OFFLine"}>}[Total Pieces Produced])
*sum({$<F1={"OFFLine"}>}[Total Pieces Produced])/sum({$<Station={"BMM","Assembly","Welding"},Product=, F1={"OFFLine"}>}[Total Pieces Produced]))))
How do I get this to work?
Any suggestions?
Thank you.
- Mark as New
- Bookmark
- Subscribe
- Mute
- Subscribe to RSS Feed
- Permalink
- Report Inappropriate Content
Are you using = sign in any of the variables? If you are, then try to remove the equal sign and see if that helps
- Mark as New
- Bookmark
- Subscribe
- Mute
- Subscribe to RSS Feed
- Permalink
- Report Inappropriate Content
Okay, I will try that.
Thank you.
- Mark as New
- Bookmark
- Subscribe
- Mute
- Subscribe to RSS Feed
- Permalink
- Report Inappropriate Content
Hi Sunny,
After removing "=" sign there is change in the value again and these are not the right ones.
Attached is the sample. Please let me know if you find something.
Thank you.
- Mark as New
- Bookmark
- Subscribe
- Mute
- Subscribe to RSS Feed
- Permalink
- Report Inappropriate Content
Hi Sunny,
Issue is solved! As you said, the problem was in my expressions that I had created for Availability, Performance and Quality. I changed them and it's working perfect!
Thanks a lot for your help! 
- Mark as New
- Bookmark
- Subscribe
- Mute
- Subscribe to RSS Feed
- Permalink
- Report Inappropriate Content
Hi Sunny,
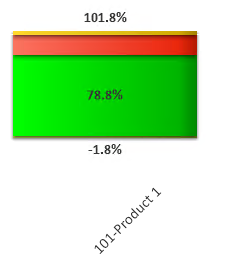
Just a quick question, how to I handle negative numbers? Because in the chart there are negative numbers as well and the formula is just neglecting negative sign and summing up the numbers. As shown in the below screenshot, value sums up to 100% if -1.8% is considered with the sign, minus ( - ). Can you please help here?
- Mark as New
- Bookmark
- Subscribe
- Mute
- Subscribe to RSS Feed
- Permalink
- Report Inappropriate Content
What would you rather want to see here?
- Mark as New
- Bookmark
- Subscribe
- Mute
- Subscribe to RSS Feed
- Permalink
- Report Inappropriate Content
Hi Sunny,
I would like to see 100% as total on top of the bar instead of 101.8%.
- Mark as New
- Bookmark
- Subscribe
- Mute
- Subscribe to RSS Feed
- Permalink
- Report Inappropriate Content
May be you will have to play with dual function... difficult to say without testing it out.... do you have a quick sample I can look at?
- Mark as New
- Bookmark
- Subscribe
- Mute
- Subscribe to RSS Feed
- Permalink
- Report Inappropriate Content
Hmm...Understand!
PFA!
- Mark as New
- Bookmark
- Subscribe
- Mute
- Subscribe to RSS Feed
- Permalink
- Report Inappropriate Content
Not entirely sure what the end goal is, but may be create an expression with 1 to see 100% all the time?