Unlock a world of possibilities! Login now and discover the exclusive benefits awaiting you.
- Qlik Community
- :
- Forums
- :
- Analytics
- :
- App Development
- :
- Re: How to keep fixed color a one of the bar in ba...
- Subscribe to RSS Feed
- Mark Topic as New
- Mark Topic as Read
- Float this Topic for Current User
- Bookmark
- Subscribe
- Mute
- Printer Friendly Page
- Mark as New
- Bookmark
- Subscribe
- Mute
- Subscribe to RSS Feed
- Permalink
- Report Inappropriate Content
How to keep fixed color a one of the bar in bar chart
HI Team,
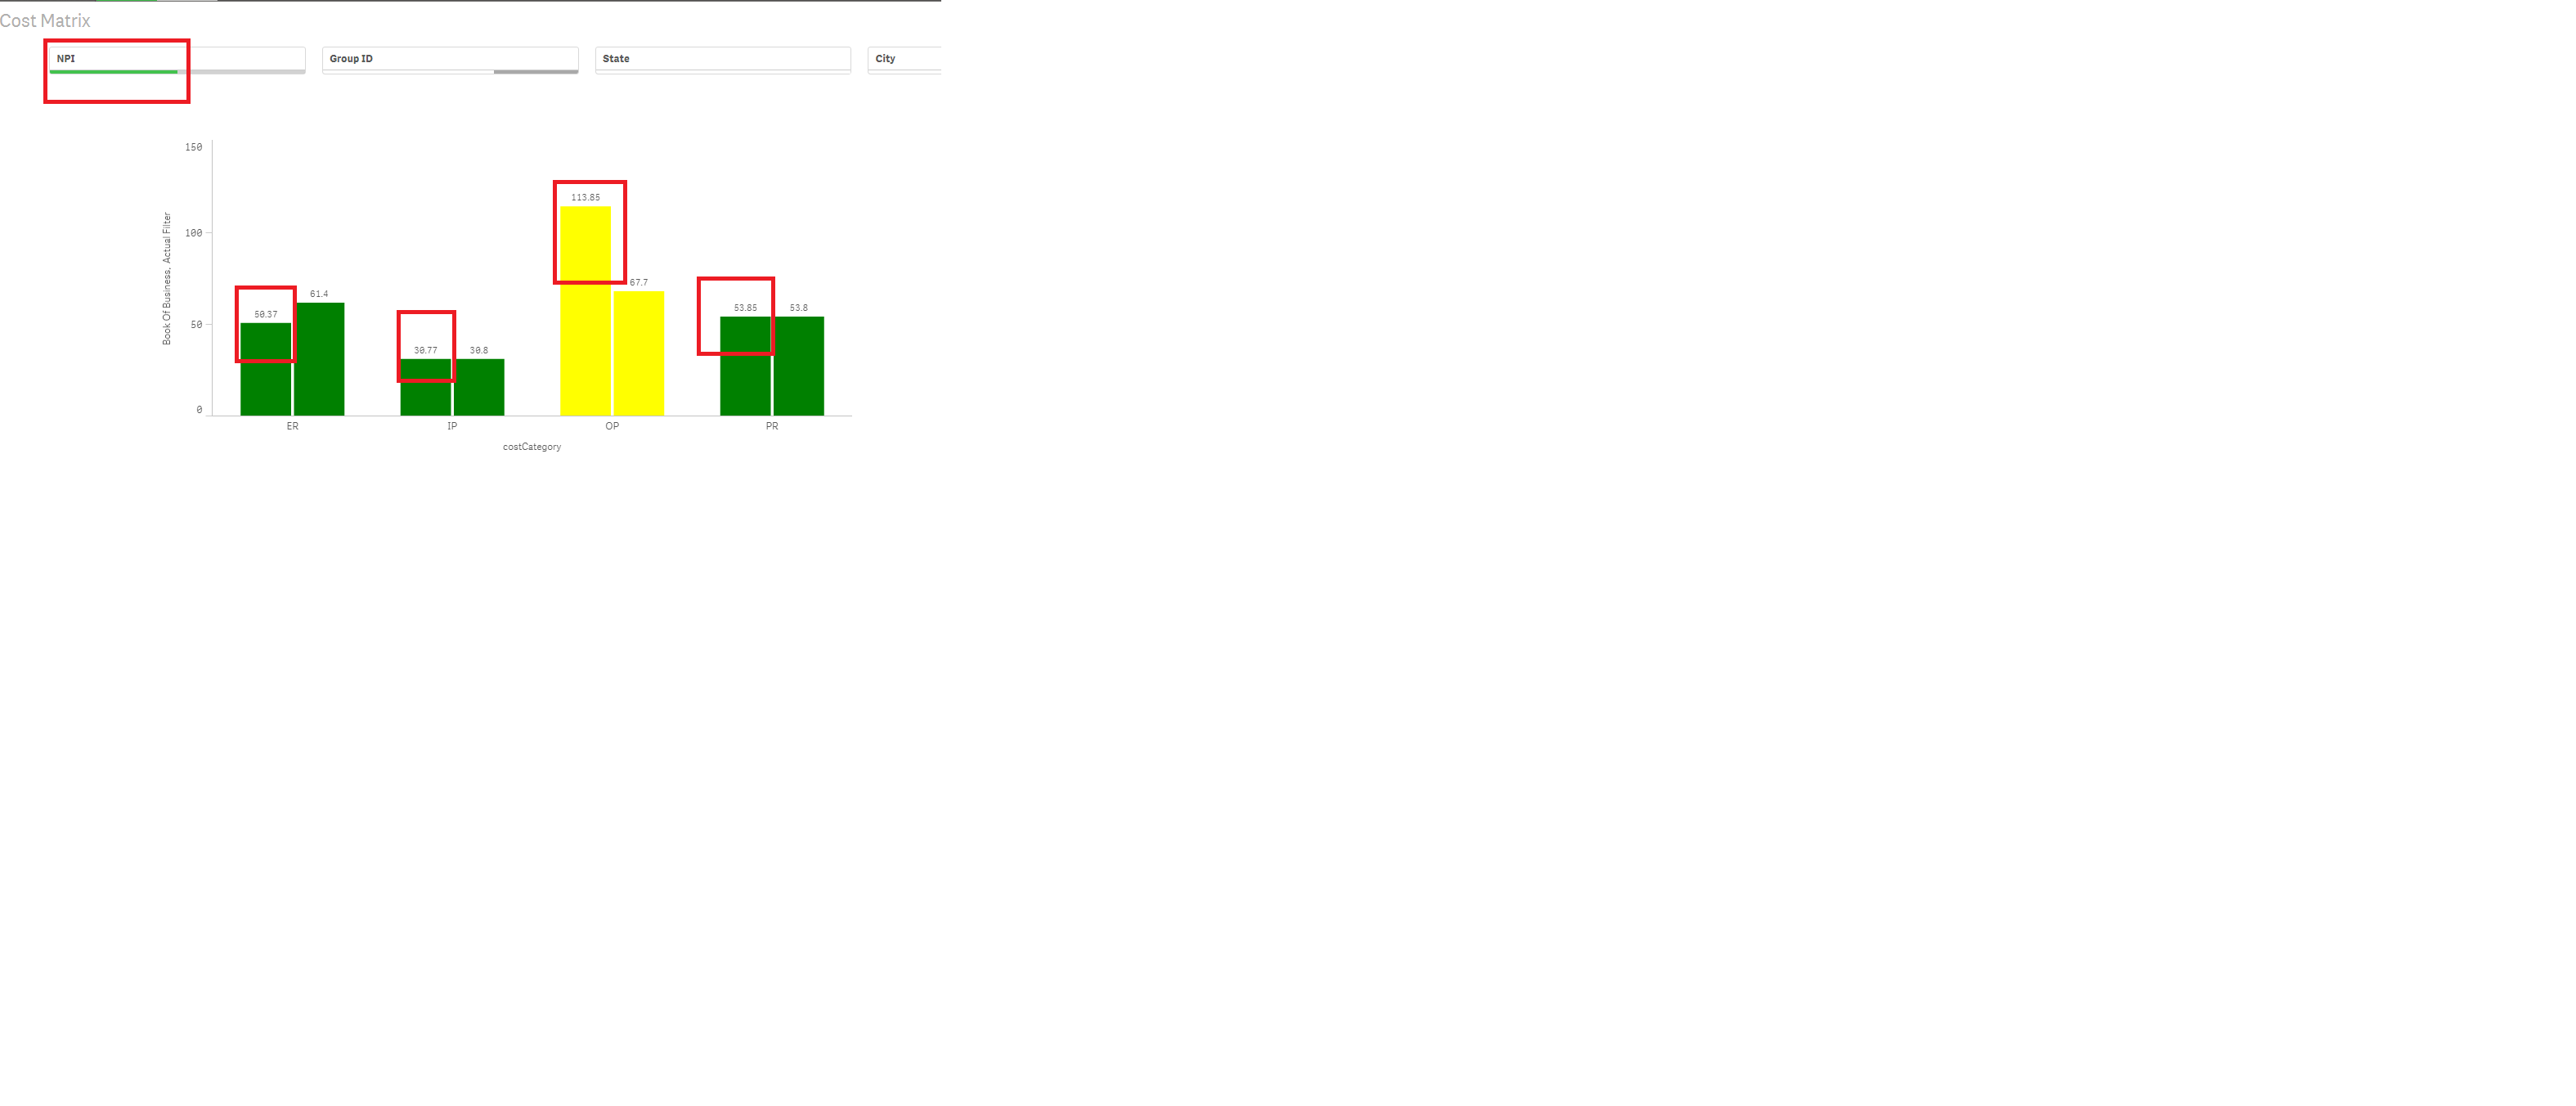
I have a bar chart where I am showing comparison between two values. one bar will be with a fixed value and the other will get changed when applies filters.
I want to keep one of the bar with a fixed color in bar chart, but when I filter,both the bars(bar with Fixed value and actual value) are getting changed.
Attached is my QVf file.
Can any one please help me on this.
Thanks,
Murali
- Mark as New
- Bookmark
- Subscribe
- Mute
- Subscribe to RSS Feed
- Permalink
- Report Inappropriate Content
Hi,
Below is the expression I have Used.
Measure M1= aggr(sum(claimAmount),cost)/sum(aggr(MM,cost,memId,PlanId)
Measure M2=aggr(sum(claimAmount1),cost)/sum(aggr(MM1,cost,memId1,PlanId1))
For M1 bar color should be Fixed, M2 bar color should be vary on applying filters. For this I have given custom expression as below at bar charts Colors and Legent>colors>Cusotom Expression.
if(aggr(sum(claimAmount),cost)/sum(aggr(MM,cost,memId,PlanId)) >(aggr(sum(claimAmount1),cost)/sum(aggr(MM1,cost,memId1,PlanId1)))*60/100, 'green',
if(aggr(sum(claimAmount),cost)/sum(aggr(MM,cost,memId,PlanId)) <(aggr(sum(claimAmount1),cost)/sum(aggr(MM1,cost,memId1,PlanId1)))*60/100, 'yellow',
if(aggr(sum(claimAmount),cost)/sum(aggr(MM,cost,memId,PlanId)) >(aggr(sum(claimAmount1),cost)/sum(aggr(MM1,cost,memId1,PlanId1)))*50/100, 'yellow',
red())))
Thanks,
Murali
- Mark as New
- Bookmark
- Subscribe
- Mute
- Subscribe to RSS Feed
- Permalink
- Report Inappropriate Content
Hi,
Below is the new ticket with more info in ticket and attached qvf file. url
- Mark as New
- Bookmark
- Subscribe
- Mute
- Subscribe to RSS Feed
- Permalink
- Report Inappropriate Content
Hi,
Can any one please for the help on this requirement.
Thanks,
Murali
- Mark as New
- Bookmark
- Subscribe
- Mute
- Subscribe to RSS Feed
- Permalink
- Report Inappropriate Content
Hi Murali,
Please try adding dimension through Master Items,
Once you have created, please go to the dimension and click on edit,
You will have two tabs, 1 for Edit dimension and 1 for value colours.
Inside the Value colors tab, you can set the color for specific dimension values.
Please check this link
Using Colors with Qlik Sense Visualizations, Measures and Dimensions
- Mark as New
- Bookmark
- Subscribe
- Mute
- Subscribe to RSS Feed
- Permalink
- Report Inappropriate Content
Hi,
If I create like that then the color will be effected for both the bars. I want one bar with Fixed color and other varies by value selected on filter.
Below is my requirement.
Measure M1= aggr(sum(claimAmount),cost)/sum(aggr(MM,cost,memId,PlanId)
Measure M2=aggr(sum(claimAmount1),cost)/sum(aggr(MM1,cost,memId1,PlanId1))
For M1 bar color should be Fixed, M2 bar color should be vary on applying filters. For this I have given custom expression as below at bar charts Colors and Legent>colors>Cusotom Expression.
if(aggr(sum(claimAmount),cost)/sum(aggr(MM,cost,memId,PlanId)) >(aggr(sum(claimAmount1),cost)/sum(aggr(MM1,cost,memId1,PlanId1)))*60/100, 'green',
if(aggr(sum(claimAmount),cost)/sum(aggr(MM,cost,memId,PlanId)) <(aggr(sum(claimAmount1),cost)/sum(aggr(MM1,cost,memId1,PlanId1)))*60/100, 'yellow',
if(aggr(sum(claimAmount),cost)/sum(aggr(MM,cost,memId,PlanId)) >(aggr(sum(claimAmount1),cost)/sum(aggr(MM1,cost,memId1,PlanId1)))*50/100, 'yellow',
red())))