Unlock a world of possibilities! Login now and discover the exclusive benefits awaiting you.
- Qlik Community
- :
- Forums
- :
- Analytics
- :
- New to Qlik Analytics
- :
- Re: Use of Sum-Expression in simple Table
- Subscribe to RSS Feed
- Mark Topic as New
- Mark Topic as Read
- Float this Topic for Current User
- Bookmark
- Subscribe
- Mute
- Printer Friendly Page
- Mark as New
- Bookmark
- Subscribe
- Mute
- Subscribe to RSS Feed
- Permalink
- Report Inappropriate Content
Use of Sum-Expression in simple Table
Hi all together,
I got a little issue in trying to sum up values. My original excel sheet gives me different projects and payments, it may be that there are several payments to a project, so it appears repeatedly in my excel sheet.
What I would like to do is creat a simple Table in QLIK, where I can show the Payments summed up and the costs, that come from another table. My problem right now is, that when I use the expression Sum(Payment), a invalid dimension is criticized.
My table looks like this when I just use the Payments as field (it's called "Erlös").
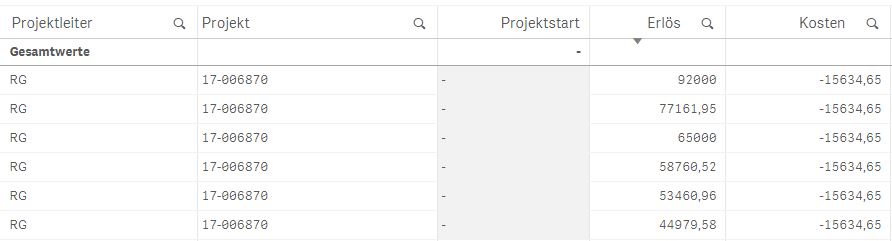
As it can be seen, QLIK lists up all the Payments from the original source. I would like to show just one column, so that it's like
Projektstart | Erlös | Kosten |
|---|---|---|
| - | 391363,01 | -15634,65 |
May it work with this form of graph or will I have to choose another one?
Thanks for the replies.
Greetings
Tom Müller
Accepted Solutions
- Mark as New
- Bookmark
- Subscribe
- Mute
- Subscribe to RSS Feed
- Permalink
- Report Inappropriate Content
Choose the appropriate dimensions (I suspect that you need Projekt, and possible ProjektLeiter), and use Sum([Erlös]) and Sum(Kosten) as expressions.
- Mark as New
- Bookmark
- Subscribe
- Mute
- Subscribe to RSS Feed
- Permalink
- Report Inappropriate Content
Choose the appropriate dimensions (I suspect that you need Projekt, and possible ProjektLeiter), and use Sum([Erlös]) and Sum(Kosten) as expressions.
- Mark as New
- Bookmark
- Subscribe
- Mute
- Subscribe to RSS Feed
- Permalink
- Report Inappropriate Content
i don't understand your label language, anyway you should create a table as below:
dimension: Projekt
expression1: Sum(Erlös)
expression2: Sum(Kosten)
- Mark as New
- Bookmark
- Subscribe
- Mute
- Subscribe to RSS Feed
- Permalink
- Report Inappropriate Content
Hallo Tom,
die beiden haben recht du kannst sum(Payment) nicht als Dimension verwenden sondern musst es als Kennzahl benutzen.
- Mark as New
- Bookmark
- Subscribe
- Mute
- Subscribe to RSS Feed
- Permalink
- Report Inappropriate Content
Thanks for the answers, works like this.
Have a nice day!