Unlock a world of possibilities! Login now and discover the exclusive benefits awaiting you.
- Qlik Community
- :
- Forums
- :
- Analytics
- :
- New to Qlik Analytics
- :
- Re: Show field in chart
- Subscribe to RSS Feed
- Mark Topic as New
- Mark Topic as Read
- Float this Topic for Current User
- Bookmark
- Subscribe
- Mute
- Printer Friendly Page
- Mark as New
- Bookmark
- Subscribe
- Mute
- Subscribe to RSS Feed
- Permalink
- Report Inappropriate Content
Show field in chart
Show accumulated variable
Good to all, since I have some companies, which have some farms, and have plots where each plot has been made several crops, I would need to show on a sheet, a table showing each farm, their plots and each plot how many days of crops there are in a previously selected date range. The problem is that it does not show me the days of cultivation if I do not include in the table each individual cultivation line of each plot.
The problem, with the table without including each individual crop, and thus does not show the days of cultivation:
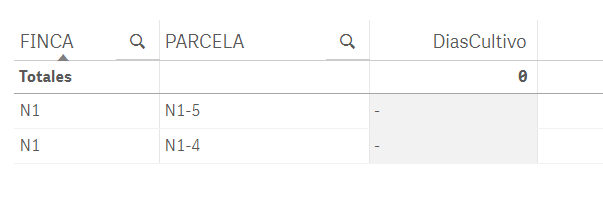
If I add to the table each individual crop if the days come out, but then we would see in the table each of the records of the plot and not only the 3 selected as in the capture above and the total number of days of cultivation in their respective column.
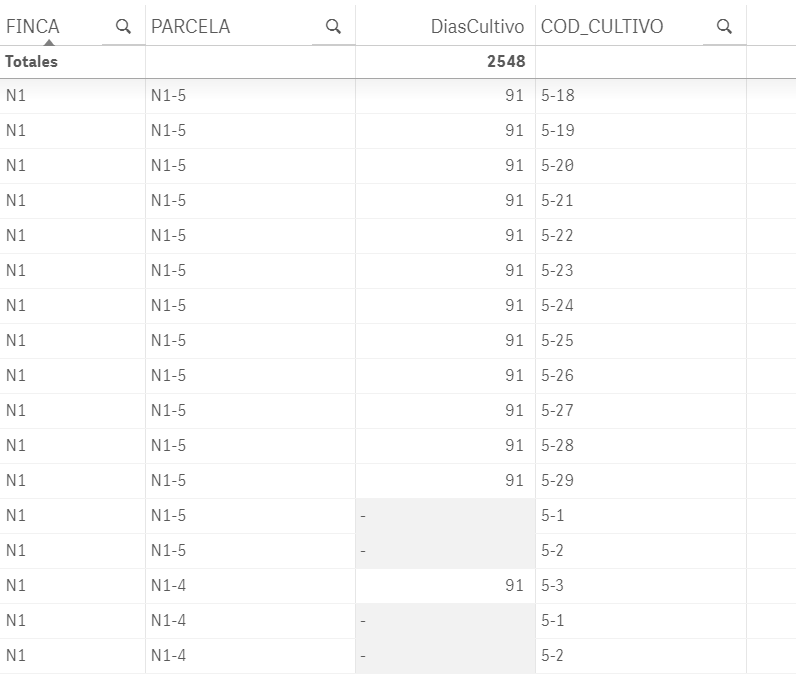
Days of cultivation is a variable, which is formed by the subtraction of the maximum date of the selected period minus the minimum date of the period, and so the days would come. Everything else is fields in the database.
- Mark as New
- Bookmark
- Subscribe
- Mute
- Subscribe to RSS Feed
- Permalink
- Report Inappropriate Content
Hello Enrique,
try to aggregate like
aggr(sum(DiasCultivo),PARCELLA)
and use this as measure DiasCultivo
- Mark as New
- Bookmark
- Subscribe
- Mute
- Subscribe to RSS Feed
- Permalink
- Report Inappropriate Content
Still not working friend. And as I said, the days of cultivation are a variable.
- Mark as New
- Bookmark
- Subscribe
- Mute
- Subscribe to RSS Feed
- Permalink
- Report Inappropriate Content
Can you upload a example app?
- Mark as New
- Bookmark
- Subscribe
- Mute
- Subscribe to RSS Feed
- Permalink
- Report Inappropriate Content