Unlock a world of possibilities! Login now and discover the exclusive benefits awaiting you.
- Qlik Community
- :
- All Forums
- :
- QlikView App Dev
- :
- Re: Aggr function within a sum function
- Subscribe to RSS Feed
- Mark Topic as New
- Mark Topic as Read
- Float this Topic for Current User
- Bookmark
- Subscribe
- Mute
- Printer Friendly Page
- Mark as New
- Bookmark
- Subscribe
- Mute
- Subscribe to RSS Feed
- Permalink
- Report Inappropriate Content
Aggr function within a sum function
Hello Everyone,
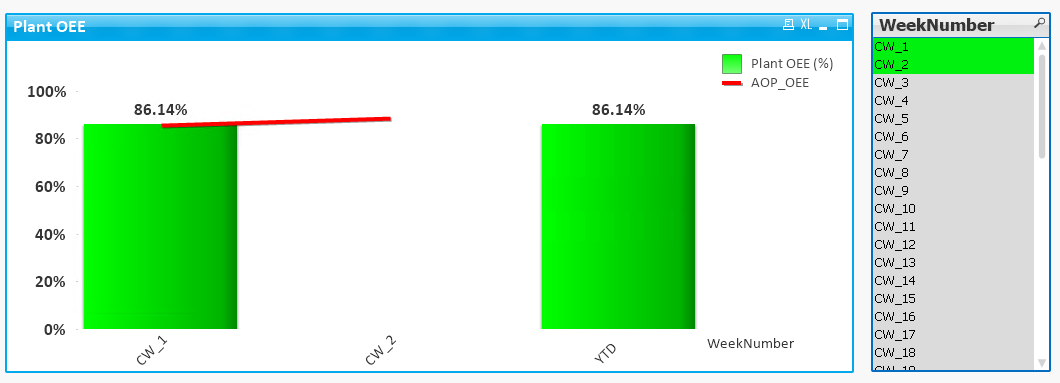
I am using aggr function within sum function as shown in the below expression. The problem is, since I am using "if" statement, the bar chart some how doesn't display the data until I choose a value in field, "F1". After using aggr function this problem is eliminated and the graph displays value even without making a selection in "F1". But now when I choose one particular week, data displayed is right, but if I choose more than one week, expression sums up for both the weeks and displays it as just one bar as shown in the below screenshot. I would want to see % values for how many ever weeks I choose. So here when I choose week1 and week2, % values for both the weeks should be visible in the graph. How do I do this?
Expression:
=(sum(aggr(if(F1='ONLine',sum({$<F1={"ONLine"},Station={"BMM"}>}"Operating Time
if(F1='OFFLine',sum({$<F1={"OFFLine"}>}"Operating Time
*sum({$<F1={"OFFLine"}>}"Planned Prod. Time
)*sum({$<Station={"BMM"}>}"Planned Prod. Time
Any suggestion?
Thank you.
- « Previous Replies
-
- 1
- 2
- Next Replies »
Accepted Solutions
- Mark as New
- Bookmark
- Subscribe
- Mute
- Subscribe to RSS Feed
- Permalink
- Report Inappropriate Content
Try this
=Avg(Aggr((sum(aggr(if(F1='ONLine',sum({$<F1={"ONLine"},Station={"BMM"}>}"Operating Time
if(F1='OFFLine',sum({$<F1={"OFFLine"}>}"Operating Time
*sum({$<F1={"OFFLine"}>}"Planned Prod. Time
)*sum({$<Station={"BMM"}>}"Planned Prod. Time
- Mark as New
- Bookmark
- Subscribe
- Mute
- Subscribe to RSS Feed
- Permalink
- Report Inappropriate Content
Anybody had a chance to look into this?
Thank you.
- Mark as New
- Bookmark
- Subscribe
- Mute
- Subscribe to RSS Feed
- Permalink
- Report Inappropriate Content
Please share a sample to check this out
- Mark as New
- Bookmark
- Subscribe
- Mute
- Subscribe to RSS Feed
- Permalink
- Report Inappropriate Content
Hi Sunny,
PFA!
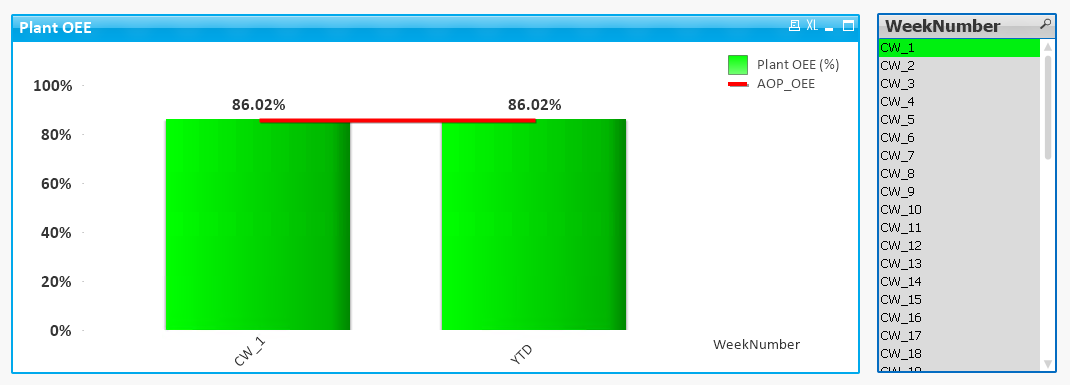
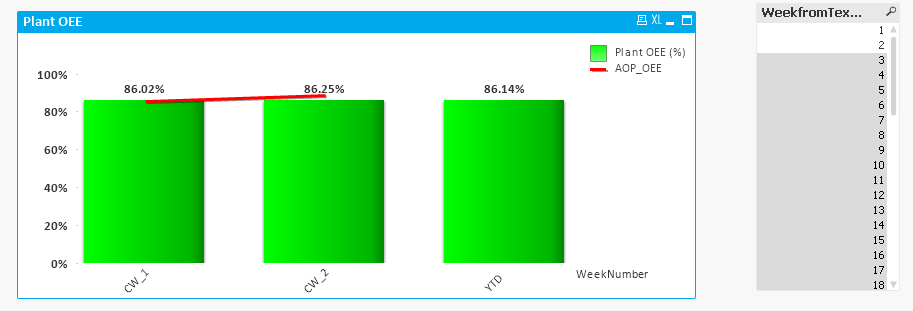
Week 1 value = 86.02%
Week 2 value = 86.25%
When both the weeks are selected, graph should display values for week 1, week 2 and also YTD which is = 86.14%
Thank you.
- Mark as New
- Bookmark
- Subscribe
- Mute
- Subscribe to RSS Feed
- Permalink
- Report Inappropriate Content
Try this
=Avg(Aggr((sum(aggr(if(F1='ONLine',sum({$<F1={"ONLine"},Station={"BMM"}>}"Operating Time
if(F1='OFFLine',sum({$<F1={"OFFLine"}>}"Operating Time
*sum({$<F1={"OFFLine"}>}"Planned Prod. Time
)*sum({$<Station={"BMM"}>}"Planned Prod. Time
- Mark as New
- Bookmark
- Subscribe
- Mute
- Subscribe to RSS Feed
- Permalink
- Report Inappropriate Content
Hi Sunny,
Perfect! You are a GENIUS 
Thanks a lot!
- Mark as New
- Bookmark
- Subscribe
- Mute
- Subscribe to RSS Feed
- Permalink
- Report Inappropriate Content
Hi Sunny,
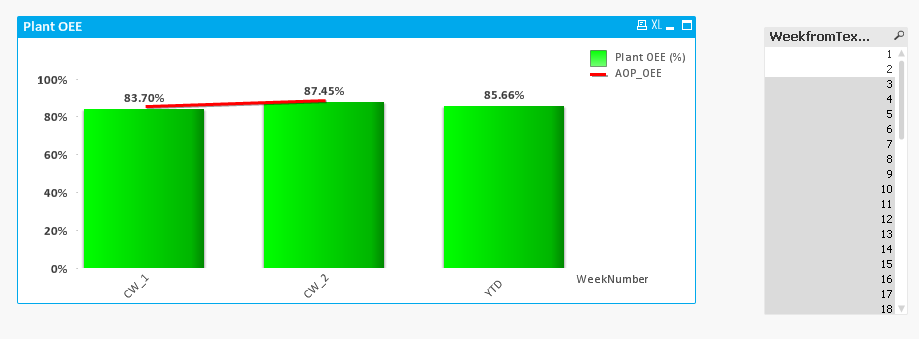
There is a small issue here in the graph where I tried your expression. For YTD, the value shall be 85.66% and not 85.57%. I think the "Avg" function here is causing this issue. Any idea how I can get this number right?
In the attached qvw you will find the graph I am mentioning about. Hope you can help me here!
Thank you.
- Mark as New
- Bookmark
- Subscribe
- Mute
- Subscribe to RSS Feed
- Permalink
- Report Inappropriate Content
How are you coming up with 85.66%? The way this chart is calculating average is doing this
83.70% + 87.45% = 171.15%/2 = 85.57%
What is the logic behind seeing 85.66%?
- Mark as New
- Bookmark
- Subscribe
- Mute
- Subscribe to RSS Feed
- Permalink
- Report Inappropriate Content
Hi Sunny,
It should not be average. When we select two weeks, the formula is the same but it has to calculate for two weeks.
I am attaching the file which has this graph also here.
Only problem I am facing with this graph is, when I select two weeks, it just sums up and shows one bar. As explained in the original post I would like to see values for two weeks and also the YTD. By applying the formula that you provided me, worked for individual weeks, but for more than one week, it isn't working as it is taking the average of both the weeks. Without doing average I get 85.66% as YTD which is the expected value. How do I do this?
Hope I am clear.
Thank you.
- Mark as New
- Bookmark
- Subscribe
- Mute
- Subscribe to RSS Feed
- Permalink
- Report Inappropriate Content
Try this expression
If(Dimensionality() = 0,
(sum(aggr(if(F1='ONLine',sum({$<F1={"ONLine"},Station={"BMM"}>}[Total Pieces Produced]/[Max pc/hr])/sum({$<F1={"ONLine"},Station={"BMM"}>}"Operating Time
if(F1='OFFLine',sum({$<F1={"OFFLine"}>}[Total Pieces Produced]/[Max pc/hr])/sum({$<F1={"OFFLine"}>}"Operating Time
*sum({$<F1={"OFFLine"}>}"Operating Time
))*sum({$<Station={"BMM"}>}"Operating Time
- « Previous Replies
-
- 1
- 2
- Next Replies »