Unlock a world of possibilities! Login now and discover the exclusive benefits awaiting you.
- Qlik Community
- :
- Forums
- :
- Analytics
- :
- App Development
- :
- Re: How to plot Cumulative Curve
- Subscribe to RSS Feed
- Mark Topic as New
- Mark Topic as Read
- Float this Topic for Current User
- Bookmark
- Subscribe
- Mute
- Printer Friendly Page
- Mark as New
- Bookmark
- Subscribe
- Mute
- Subscribe to RSS Feed
- Permalink
- Report Inappropriate Content
How to plot Cumulative Curve
Hello Guys,
I need to plot two different cumulative curve
1. Cumulative curve
Dimension :- Year(LoadedDate)*100+Month(LoadedDate)
Measure:- Sum(Load)
2. Cumulative Curve
Dimension :- Year(LoadedDate)*100+Month(LoadedDate)
Dimension :- (Round((HitRateProjects*100),0.01)*[Hours Flow4])
Measure:- Sum(Load)
Additional Info :- I have Unique projects Id for 300 projects
Thanks In Advance,
Ravi
Accepted Solutions
- Mark as New
- Bookmark
- Subscribe
- Mute
- Subscribe to RSS Feed
- Permalink
- Report Inappropriate Content
- Mark as New
- Bookmark
- Subscribe
- Mute
- Subscribe to RSS Feed
- Permalink
- Report Inappropriate Content
Why don't you first create this in the script
LOAD Year(LoadedDate)*100+Month(LoadedDate) as YearMonth
and then try this
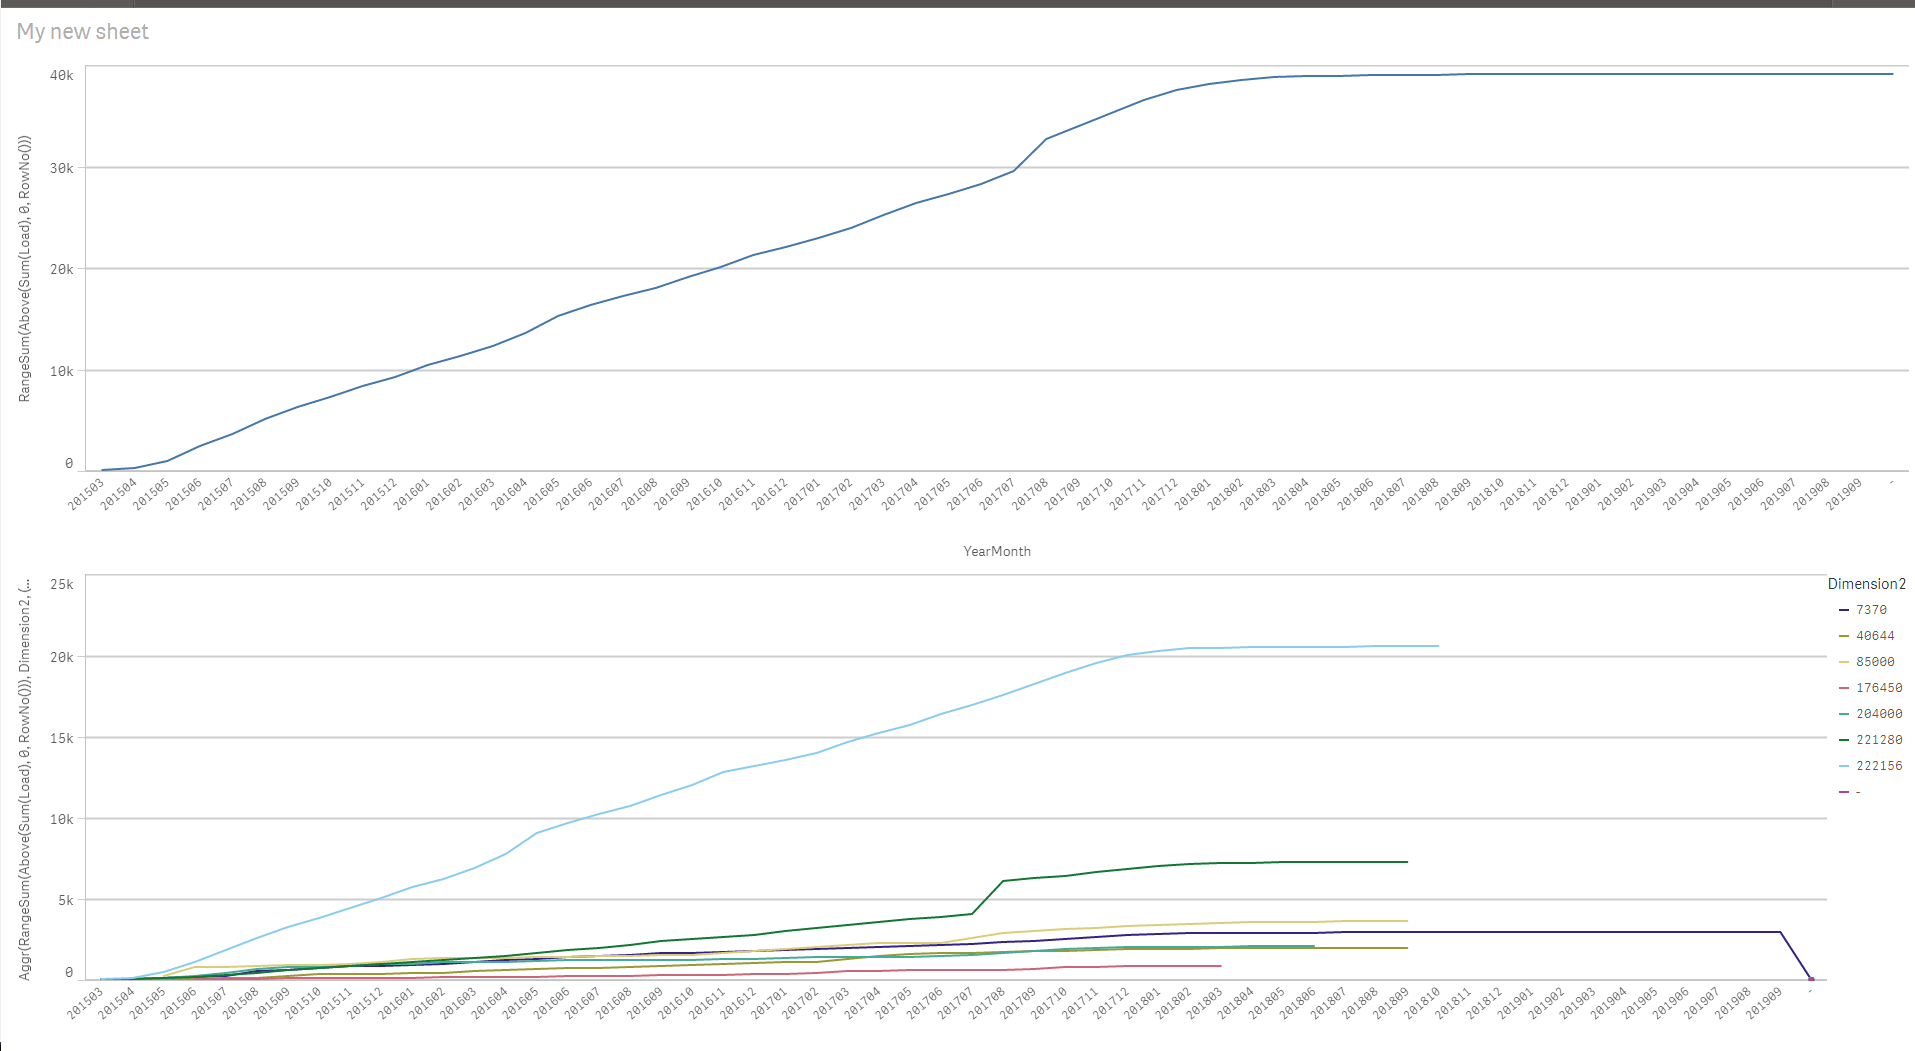
Dimension
YearMonth
Expression
RangeSum(Above(Sum(Load), 0, RowNo()))
For the second chart, may be it might make sense to do the manipulation in the script for the second dimension also
LOAD (Round((HitRateProjects*100),0.01)*[Hours Flow4]) as Dimension2
and then may be this
Dimension
YearMonth
Dimension2
Expression
Aggr(RangeSum(Above(Sum(Load), 0, RowNo())), Dimension2, YearMonth)
- Mark as New
- Bookmark
- Subscribe
- Mute
- Subscribe to RSS Feed
- Permalink
- Report Inappropriate Content
Thanks sunny for immediate response !
I have to plot Cumulative Line Curve . So Should I be using Extensions Such as D3 Visualization Library or Normal Line Curve in both the cases .
So Measure:- Sum(Load) where Load field contains Decimal values for all 300 projects
Should it remain the same ?
thanks,
ravi
- Mark as New
- Bookmark
- Subscribe
- Mute
- Subscribe to RSS Feed
- Permalink
- Report Inappropriate Content
For accumulated line, I don't think you need an extension... but since I have not seen you data, I wouldn't know. Would you be able to share a sample
- Mark as New
- Bookmark
- Subscribe
- Mute
- Subscribe to RSS Feed
- Permalink
- Report Inappropriate Content
hey Sunny,
yes sure, i am sharing a xlsx file which has the required data .
- Mark as New
- Bookmark
- Subscribe
- Mute
- Subscribe to RSS Feed
- Permalink
- Report Inappropriate Content
Check attached
- Mark as New
- Bookmark
- Subscribe
- Mute
- Subscribe to RSS Feed
- Permalink
- Report Inappropriate Content
Thanks Sunny
thanks a ton for giving me a solution ! It worked for me . 