Unlock a world of possibilities! Login now and discover the exclusive benefits awaiting you.
- Qlik Community
- :
- Forums
- :
- Analytics
- :
- New to Qlik Analytics
- :
- Qlik Sense - Create columns based on dimension val...
- Subscribe to RSS Feed
- Mark Topic as New
- Mark Topic as Read
- Float this Topic for Current User
- Bookmark
- Subscribe
- Mute
- Printer Friendly Page
- Mark as New
- Bookmark
- Subscribe
- Mute
- Subscribe to RSS Feed
- Permalink
- Report Inappropriate Content
Qlik Sense - Create columns based on dimension values
Hi All,
I have data in the following table format:
| Full Name | Systems Support | |
| Name1@gmail.com | Name 1 | System 1 |
| Name1@gmail.com | Name 1 | System 2 |
| Name1@gmail.com | Name 1 | System 3 |
| Name2@gmail.com | Name 2 | System 1 |
| Name2@gmail.com | Name 2 | System 4 |
| Name2@gmail.com | Name 2 | System 2 |
| Name2@gmail.com | Name 2 | System 5 |
| Name2@gmail.com | Name 2 | System 3 |
| Name3@gmail.com | Name 3 | System 1 |
| Name3@gmail.com | Name 3 | System 2 |
I need to create the following using a simple table in Qlik sense:
| Name | System 1 Support | System 2 Support | System 3 Support | System 4 Support | System 5 Support | |
| Name1@gmail.com | Name 1 | Yes | Yes | Yes | ||
| Name2@gmail.com | Name 2 | Yes | Yes | Yes | Yes | Yes |
| Name3@gmail.com | Name 3 | Yes | Yes |
How do I create a create a conditional dimension column? Please help.
Accepted Solutions
- Mark as New
- Bookmark
- Subscribe
- Mute
- Subscribe to RSS Feed
- Permalink
- Report Inappropriate Content
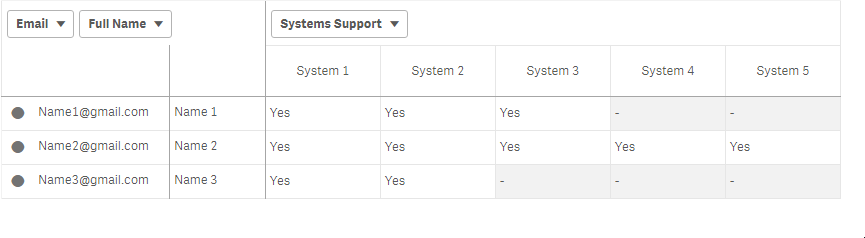
1) Create a Pivot Table
2) Add Email as Dimension
3) Click "Add data" / "Row" and select "Full Name"
4) Click "Add data" / "Column" and select "Systems Support"
5) Click "Add data" / "Measure" and type in ='Yes'
And you should end up with this:
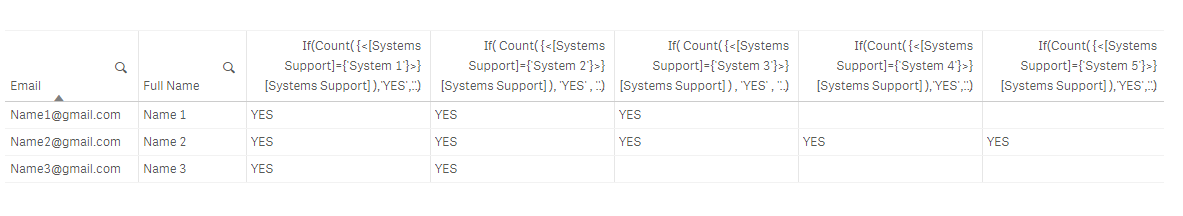
You can also do it using a Table (not pivot table) by adding each Systems Support column as separate measures with the expression:
If( Count( {<[Systems Support]={'System 1'}>} [System Support) , 'YES' , ' ' )
using a set expression to single out the particular row and checking if it gives a 1 or 0 which the If-function can replace with a 'YES' or a blank ' '
Here is what I got in a (straight/regular) table in Qlik Sense:
- Mark as New
- Bookmark
- Subscribe
- Mute
- Subscribe to RSS Feed
- Permalink
- Report Inappropriate Content
1) Create a Pivot Table
2) Add Email as Dimension
3) Click "Add data" / "Row" and select "Full Name"
4) Click "Add data" / "Column" and select "Systems Support"
5) Click "Add data" / "Measure" and type in ='Yes'
And you should end up with this:
You can also do it using a Table (not pivot table) by adding each Systems Support column as separate measures with the expression:
If( Count( {<[Systems Support]={'System 1'}>} [System Support) , 'YES' , ' ' )
using a set expression to single out the particular row and checking if it gives a 1 or 0 which the If-function can replace with a 'YES' or a blank ' '
Here is what I got in a (straight/regular) table in Qlik Sense:
- Mark as New
- Bookmark
- Subscribe
- Mute
- Subscribe to RSS Feed
- Permalink
- Report Inappropriate Content
Is there a way to show only Value columns with 'yes' values for selected dimension?
E.g. Selecting Name 1 I want the table to show only Columns Systems Support 1, 2 and 3, because their values contain 'YES'.