Unlock a world of possibilities! Login now and discover the exclusive benefits awaiting you.
- Qlik Community
- :
- Forums
- :
- Analytics
- :
- New to Qlik Analytics
- :
- Re: Problem in calculating Growth by Month-Year(Th...
- Subscribe to RSS Feed
- Mark Topic as New
- Mark Topic as Read
- Float this Topic for Current User
- Bookmark
- Subscribe
- Mute
- Printer Friendly Page
- Mark as New
- Bookmark
- Subscribe
- Mute
- Subscribe to RSS Feed
- Permalink
- Report Inappropriate Content
Problem in calculating Growth by Month-Year(This year month vs Pre Year Month)
Hi Techies,
I am facing a problem while calculating growth% by Month-Year in Table chart. The result I am expecting is :
Month-Year KPI Growth%
Jul-2017 A 10%(Val of Jul-2017 / Val of Jul-2016 -1)
Jul-2017 B 20%
Jul-2017 C 30%
Aug-2017 A 10%
Aug-2017 B 20%
Aug-2017 C 30%
Formula I am considerng is : July 2017 Sales/July 2016 -1
Please let me know how to do it
Thanks in advance
Best,
Rohit
- Tags:
- growth caluclation
- Mark as New
- Bookmark
- Subscribe
- Mute
- Subscribe to RSS Feed
- Permalink
- Report Inappropriate Content
Hi,
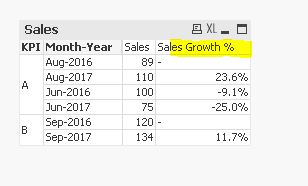
have you tried like below,
(Sum(Amount)-Above(Sum(Amount)))/Above(Sum(Amount))
- Mark as New
- Bookmark
- Subscribe
- Mute
- Subscribe to RSS Feed
- Permalink
- Report Inappropriate Content
Hi,
I've tackled this type of requests with the "As Of" approach in which I have a list of As Of periods, then a table that maps those As Of Periods with current and previous (rolling 3 or 12 months, financial vs calendar periods, etc.) and this table associated with your fact table. This approach makes calculations much simpler and it's more flexible, but you need to spend time building it. I guess the decision on the approach depends on the complexity of each App.
I posted this based on the As Of approach: My 2 cents on Time Analysis
Happy to discuss further,
I hope it helps,
Luis
PS. If it's something quick and simple, I wouldn't worry too much about it and follow Deva's approach
- Mark as New
- Bookmark
- Subscribe
- Mute
- Subscribe to RSS Feed
- Permalink
- Report Inappropriate Content
How did you set the table as ?
KPI Month Year
A Aug-2016
A Aug-2017
- Mark as New
- Bookmark
- Subscribe
- Mute
- Subscribe to RSS Feed
- Permalink
- Report Inappropriate Content
I agree with luismadriz here, that an The As-Of Table might be the best way to handle this situation.
- Mark as New
- Bookmark
- Subscribe
- Mute
- Subscribe to RSS Feed
- Permalink
- Report Inappropriate Content
Hi Devarasu,
Your solution is working execpt when I make a selection in Year , it is not giving mw growth%? Can you please tell me what to do for Year selection ?
- Mark as New
- Bookmark
- Subscribe
- Mute
- Subscribe to RSS Feed
- Permalink
- Report Inappropriate Content
Try this
(Sum(Amount)- Above(Sum({<Year, MonthYear>} Amount)))/Above(Sum({<Year, MonthYear>} Amount))
or simplify the above expression to this
Sum(Amount)/Above(Sum({<Year, MonthYear>} Amount)) - 1
But I still think that The As-Of Table is the right way to approach this...