Unlock a world of possibilities! Login now and discover the exclusive benefits awaiting you.
- Qlik Community
- :
- All Forums
- :
- QlikView App Dev
- :
- Re: Bar chart with overlaped bar
- Subscribe to RSS Feed
- Mark Topic as New
- Mark Topic as Read
- Float this Topic for Current User
- Bookmark
- Subscribe
- Mute
- Printer Friendly Page
- Mark as New
- Bookmark
- Subscribe
- Mute
- Subscribe to RSS Feed
- Permalink
- Report Inappropriate Content
Bar chart with overlaped bar
Hello,
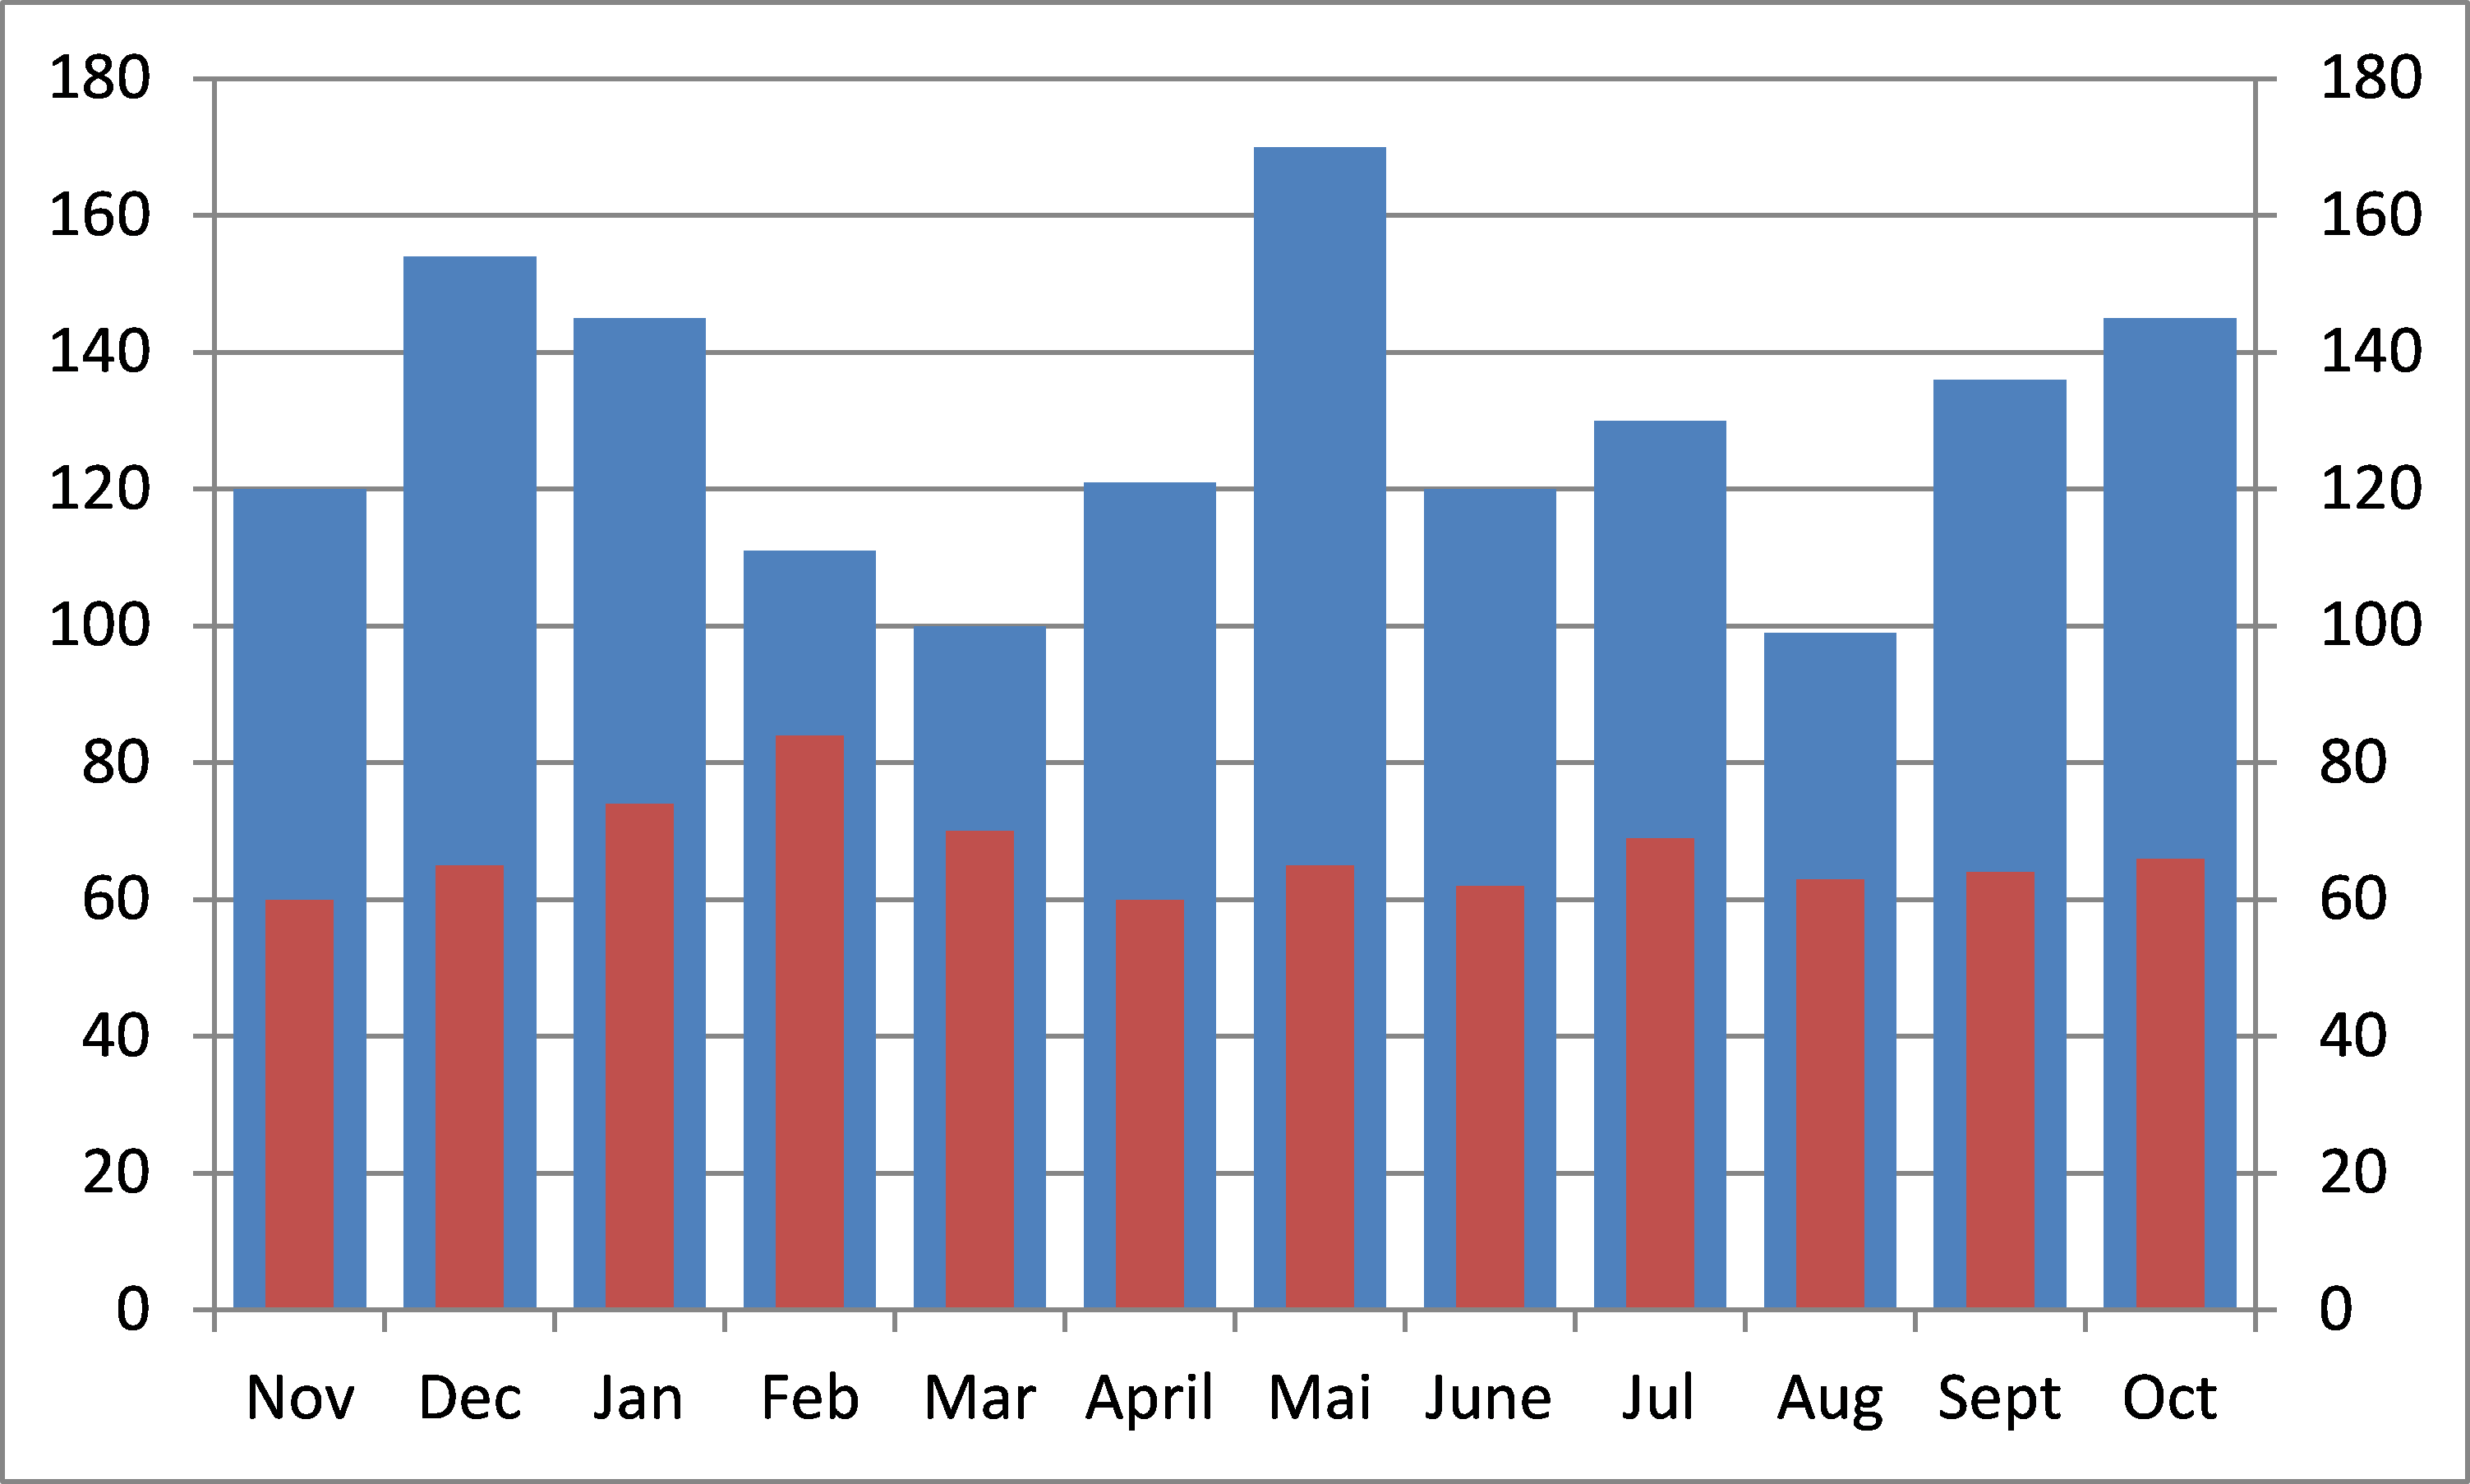
Do you know if it's possible to do this kind of graph ? (with for each month, 2 différents expressions at the same place but with different bar witdh)
Many thanks in advance
- Mark as New
- Bookmark
- Subscribe
- Mute
- Subscribe to RSS Feed
- Permalink
- Report Inappropriate Content
very ingenious !
many thanks
- Mark as New
- Bookmark
- Subscribe
- Mute
- Subscribe to RSS Feed
- Permalink
- Report Inappropriate Content
Nice work. Is if possible to have three bars overlapping, i.e. Value1, Value2 and Value3? If yes, what change or addition would need to be made?
- Mark as New
- Bookmark
- Subscribe
- Mute
- Subscribe to RSS Feed
- Permalink
- Report Inappropriate Content
thanks,
can you describe how the three bar version should look like?
- Mark as New
- Bookmark
- Subscribe
- Mute
- Subscribe to RSS Feed
- Permalink
- Report Inappropriate Content
Hello Marco:
Thanks for the reply. First, this is pretty cool and clever. Nice job. I’m thinking, though it may not be doable, is that you may be able to adjust the Cluster Distance for the third value to accommodate it??? The more I think about it, the more I think this can’t be done with more than 2 values. So, as you have now, if value 2 is larger than value 1, it’s bar-width is wider than value 1’s. Value 3’s would need to be wider than value 2’s. I get it though or I’m starting to, that this probably can’t be done or at least not natively to Qlikview.
Thanks again for the original solution!
- Mark as New
- Bookmark
- Subscribe
- Mute
- Subscribe to RSS Feed
- Permalink
- Report Inappropriate Content
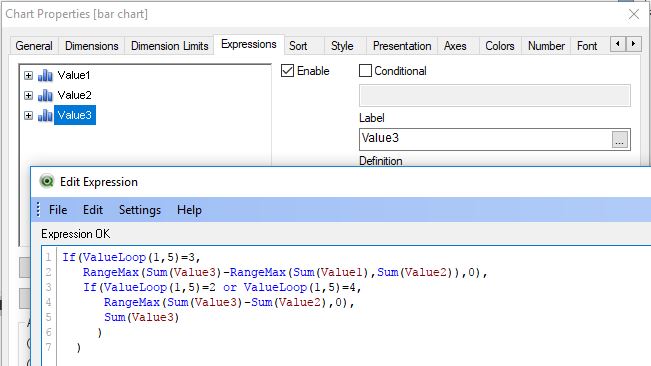
I guess a three bar version might work like this:
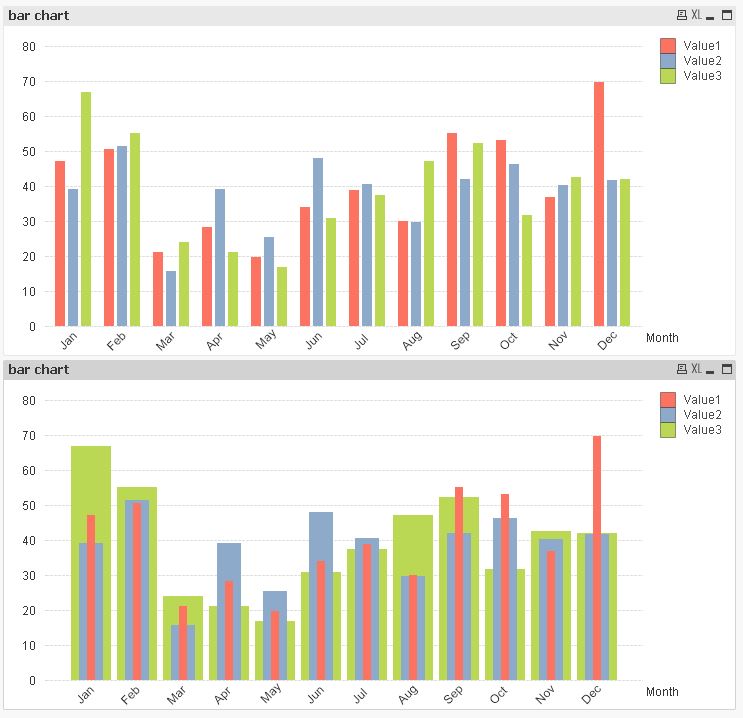
hope this helps
regards
Marco
- Mark as New
- Bookmark
- Subscribe
- Mute
- Subscribe to RSS Feed
- Permalink
- Report Inappropriate Content
YES!!!! Awesome. Going more than 3 bars, probably wouldn't be a good idea, but think about what you can show with three. Previous year, current year and future year, for example. Ok. Maybe not a good example, but the point is when you have limited screen real estate, being able to show 3 things in one chart can be a big deal. I know there may be other ways to do it, but this is a pretty cool way to do so using a bar chart. The key, obviously, is to use the right Value X's. So you may have to set your data up appropriately, but you've solved the hard part once you have.
While I don't know if anyone else has ever done this in Qlikview or not, you may be able to call this the Wedel Bar Chart.  Well done and thank you very much!
- Mark as New
- Bookmark
- Subscribe
- Mute
- Subscribe to RSS Feed
- Permalink
- Report Inappropriate Content
Thanks, I'm glad you find it useful.
Although agreeing that it probably doesn't make much sense to go beyond 3 bars, I couldn't resist to see how it would look like 😉
Here's one example using 6 bars
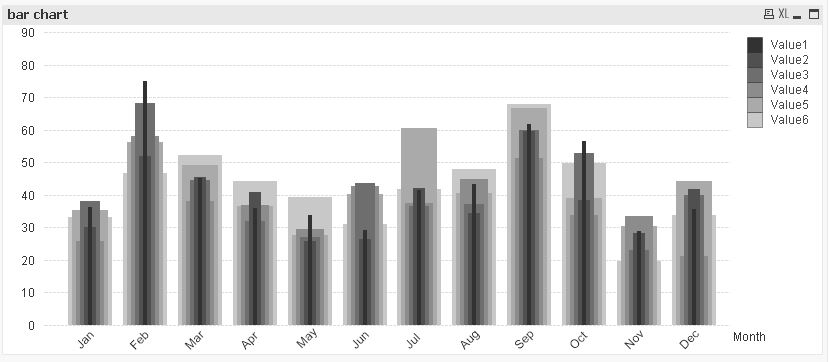
(Based on its looks I was about to propose a name change into "Manhattan bar chart" until realizing that it could be mistaken for the 3D bar chart version already named like that, but maybe "2D Manhattan bar chart" might do?)
Despite possible applications of the chart itself, maybe the used expressions could help someone:
Expressions 1 to 6:
Pick(fabs(ValueLoop(1,11)-6)+1,
    Sum(Value1)
    )
Pick(fabs(ValueLoop(1,11)-6)+1,
    RangeMax(Sum(Value2)-Sum(Value1),0),
    Sum(Value2)
    )
Pick(fabs(ValueLoop(1,11)-6)+1,
    RangeMax(Sum(Value3)-RangeMax(Sum(Value1),Sum(Value2)),0),
    RangeMax(Sum(Value3)-Sum(Value2),0),
    Sum(Value3)
    )
Pick(fabs(ValueLoop(1,11)-6)+1,
    RangeMax(Sum(Value4)-RangeMax(Sum(Value1),Sum(Value2),Sum(Value3)),0),
    RangeMax(Sum(Value4)-RangeMax(Sum(Value2),Sum(Value3)),0),
    RangeMax(Sum(Value4)-Sum(Value3),0),
    Sum(Value4)
    )
Pick(fabs(ValueLoop(1,11)-6)+1,
    RangeMax(Sum(Value5)-RangeMax(Sum(Value1),Sum(Value2),Sum(Value3),Sum(Value4)),0),
    RangeMax(Sum(Value5)-RangeMax(Sum(Value2),Sum(Value3),Sum(Value4)),0),
    RangeMax(Sum(Value5)-RangeMax(Sum(Value3),Sum(Value4)),0),
    RangeMax(Sum(Value5)-Sum(Value4),0),
    Sum(Value5)
    )
Pick(fabs(ValueLoop(1,11)-6)+1,
    RangeMax(Sum(Value6)-RangeMax(Sum(Value1),Sum(Value2),Sum(Value3),Sum(Value4),Sum(Value5)),0),
    RangeMax(Sum(Value6)-RangeMax(Sum(Value2),Sum(Value3),Sum(Value4),Sum(Value5)),0),
    RangeMax(Sum(Value6)-RangeMax(Sum(Value3),Sum(Value4),Sum(Value5)),0),
    RangeMax(Sum(Value6)-RangeMax(Sum(Value4),Sum(Value5)),0),
    RangeMax(Sum(Value6)-Sum(Value5),0),
    Sum(Value6)
    )
Marco
- Mark as New
- Bookmark
- Subscribe
- Mute
- Subscribe to RSS Feed
- Permalink
- Report Inappropriate Content
Wow! The expressions will absolutely help someone.............like me.  This is, again, awesome. More than 3 bars is probably too much. Think about senior management. It's hard to keep their attention as it is, so the more complicated, the less likely they are to pay attention, if you get my drift. With that said though, I do see a potential use for more than 3 bars. For example if you have to do some type of multi-year comparison of actuals (I know it can be done other ways, but if real estate is limited in your display.....).
This is a "great to have in your back pocket bar chart" that can be pretty easily put together. I t would not have been easy without your info above.  Again, nice work Marco!
I hate to ask this, so please excuse my lack of knowledge, but could you explain in layman terms, a short version, of what the above pick expressions are doing?
- Mark as New
- Bookmark
- Subscribe
- Mute
- Subscribe to RSS Feed
- Permalink
- Report Inappropriate Content
P.S. 2d Manhattan I suppose would work, but can we get your name on it??? This is really nice work within Qlikview.
- Mark as New
- Bookmark
- Subscribe
- Mute
- Subscribe to RSS Feed
- Permalink
- Report Inappropriate Content
Once again thanks for your kind reply.
The idea behind those expressions is to calculate the height that each bar towers above the highest bar in front of it.
The Pick() function switches between the expressions corresponding to the cluster segments, with the "Fabs(ValueLoop..." part taking advantage of the cluster symmetry, i.e. bar segments in the same distance from the middle segment to the left or right share common height/expression.
hopefully this makes any sense.
Marco