Unlock a world of possibilities! Login now and discover the exclusive benefits awaiting you.
- Qlik Community
- :
- Forums
- :
- Analytics
- :
- App Development
- :
- Image with Pie and Gauge chart in Qliksense
- Subscribe to RSS Feed
- Mark Topic as New
- Mark Topic as Read
- Float this Topic for Current User
- Bookmark
- Subscribe
- Mute
- Printer Friendly Page
- Mark as New
- Bookmark
- Subscribe
- Mute
- Subscribe to RSS Feed
- Permalink
- Report Inappropriate Content
Image with Pie and Gauge chart in Qliksense
Hi All,
I have requirement to implement image in pie and gauge chart .is there any way to achieve this by using anything(default Feature or any extension).Please help me out hows can achieve this in Qliksense .
Apart from that i have to give color in pie chart similar to images .how i can achieve this .Please help me out
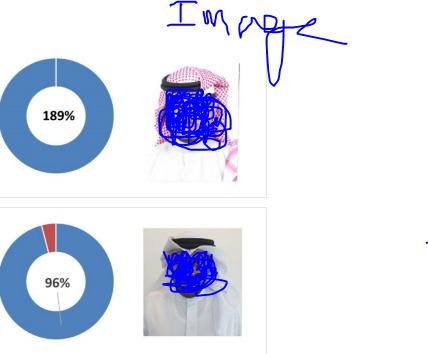
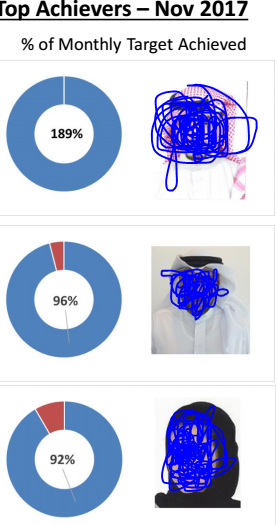
I have requirement to show top 3 target achievers in 3 pie/Gauge charts with respects to color
For example:
person A have 189% Sales so color for pie chart will be blue only
person B have done only 96 % sales out of 100 so i want 96 % should be in blue and remaining 4 % should be in red
Person C have done only 92% sales out of 100 so i want 92% should be in blue and remaining 8% should in red
Please find attached image for reference
- Mark as New
- Bookmark
- Subscribe
- Mute
- Subscribe to RSS Feed
- Permalink
- Report Inappropriate Content
What is your bench mark % to change the color?
Like more than 50% or 40% then blue or red....
You cannot have conditional image appearing in Qlik Sense, i'm not sure if you can use Image extensions available in Qlik Branch
check below links
http://branch.qlik.com/#!project/583764c83dc0cfc4138afa26