Unlock a world of possibilities! Login now and discover the exclusive benefits awaiting you.
- Qlik Community
- :
- Forums
- :
- Analytics
- :
- App Development
- :
- Re: How can remove scroll bar in qliksense and abl...
- Subscribe to RSS Feed
- Mark Topic as New
- Mark Topic as Read
- Float this Topic for Current User
- Bookmark
- Subscribe
- Mute
- Printer Friendly Page
- Mark as New
- Bookmark
- Subscribe
- Mute
- Subscribe to RSS Feed
- Permalink
- Report Inappropriate Content
How can remove scroll bar in qliksense and able to view selected data instead of scroll the table in qliksense
How can remove scroll bar in qliksense and able to view selected data instead of scroll the table in qliksense.
Like select month then I want to see data for selected months in the pivot table and do not want to see data for other months and no need to use scroll bar if I use random month data in the table...
Somebody help for this query
- « Previous Replies
-
- 1
- 2
- Next Replies »
- Mark as New
- Bookmark
- Subscribe
- Mute
- Subscribe to RSS Feed
- Permalink
- Report Inappropriate Content
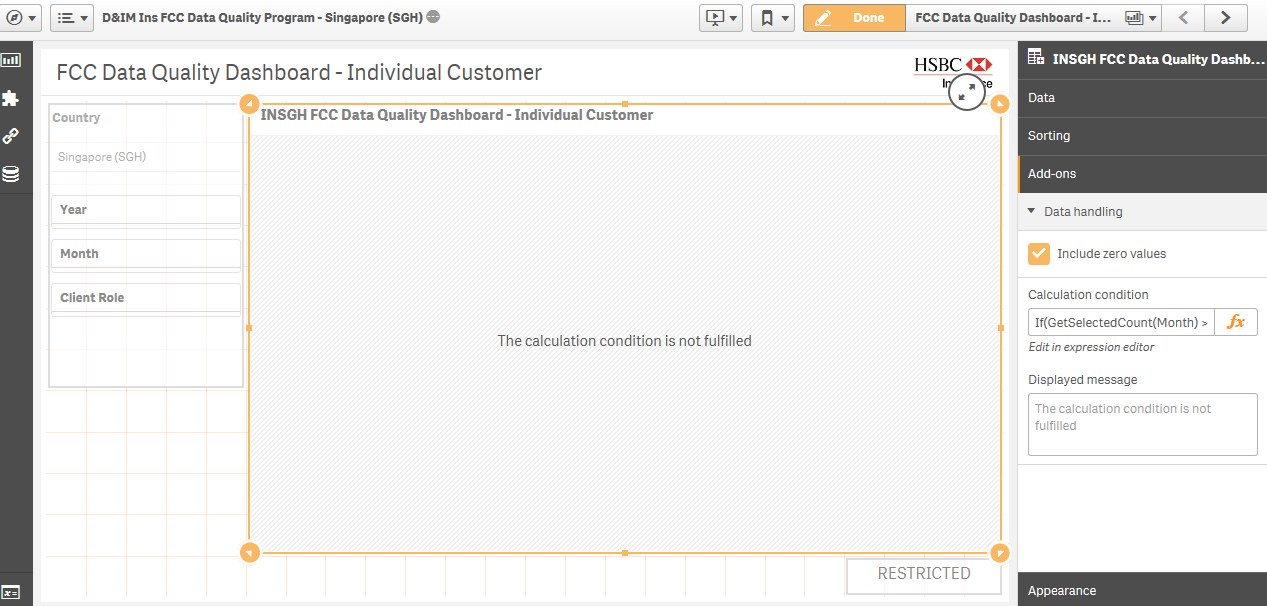
Facing issue while using condition as If(GetSelectedCount(Month) >=1, 1,0) PFA screen shoe
- Mark as New
- Bookmark
- Subscribe
- Mute
- Subscribe to RSS Feed
- Permalink
- Report Inappropriate Content
Can you please suggest something which will helpful to view selected month data
- Mark as New
- Bookmark
- Subscribe
- Mute
- Subscribe to RSS Feed
- Permalink
- Report Inappropriate Content
did you try selecting any of the months from your filter pane?
- Mark as New
- Bookmark
- Subscribe
- Mute
- Subscribe to RSS Feed
- Permalink
- Report Inappropriate Content
Yes..But not able to view data
- Mark as New
- Bookmark
- Subscribe
- Mute
- Subscribe to RSS Feed
- Permalink
- Report Inappropriate Content
Pivot table containing 2 Years data and while selecting random month, we have to scroll the bar while view the data.
Can you please help me to fix this issue. I want to view selected month data and not able to see unselected data..
Interested in current selection data on basis of Month.
Appreciate for your quick response..
- Mark as New
- Bookmark
- Subscribe
- Mute
- Subscribe to RSS Feed
- Permalink
- Report Inappropriate Content
Hi,
I am loading this data table and created dashboard. all months data are reflecting in the pivot table.
When I select month then I want to see only selected month data and other month data column should no display but when I selected random month , scrolling the scroll bar of the table to view the data.
Client want to see only current selection data on the basis of year and month.
I have used below condition in the measure to calculate % (Percentage) .
if([Client Type] ='Individual' , (sum(Values) - (Value))/(sum({1}Values)),Null())
somebody help to fix that issue. Tuesday. I will give presentation to client and before that I want to fix that issue.
Appreciate for quick responses.
Michalina Kuczynska had helped me with some solution and logic condition but it's not work. Thanks Mic for your efforts/
Still finding solution....................
Tables:
Database_SGH:
CrossTable (Month, Value, 7)
LOAD
"Data Elements",
"FCC Top 20",
"Client Type",
"DQ Dimension",
COUNTRY,
CLIENT_ROLE,
DE_KEY,
"12/31/2016",
"1/31/2017",
"2/28/2017",
"3/31/2017",
"4/30/2017",
"5/31/2017",
"6/30/2017",
"7/31/2017",
"8/31/2017",
"9/30/2017",
"10/31/2017",
"11/30/2017",
"12/31/2017"
FROM [lib://AttachedFiles/Data Profiling Template.xlsx]
(ooxml, embedded labels, table is Database_SGH);
Total_SGH:
CrossTable (Month, Values, 1)
LOAD
"Client Type" as SGH_Client_Type ,
"12/31/2016",
"1/31/2017",
"2/28/2017",
"3/31/2017",
"4/30/2017",
"5/31/2017",
"6/30/2017",
"7/31/2017",
"8/31/2017",
"9/30/2017",
"10/31/2017",
"11/30/2017",
"12/31/2017"
FROM [lib://AttachedFiles/Data Profiling Template.xlsx]
(ooxml, embedded labels, table is Total_SGH);
- Mark as New
- Bookmark
- Subscribe
- Mute
- Subscribe to RSS Feed
- Permalink
- Report Inappropriate Content
Any suggestion or helpful guidance which can use and check it...
- « Previous Replies
-
- 1
- 2
- Next Replies »