Unlock a world of possibilities! Login now and discover the exclusive benefits awaiting you.
- Qlik Community
- :
- All Forums
- :
- QlikView App Dev
- :
- Dimension Whalecurve
- Subscribe to RSS Feed
- Mark Topic as New
- Mark Topic as Read
- Float this Topic for Current User
- Bookmark
- Subscribe
- Mute
- Printer Friendly Page
- Mark as New
- Bookmark
- Subscribe
- Mute
- Subscribe to RSS Feed
- Permalink
- Report Inappropriate Content
Dimension Whalecurve
Hello,
For the analysis of customer profitability, I am trying to create a whale curve. Barry Harmsen's blog contains a great post 'Visualizing Customer Profitability with a Whale Curve' on how to start on this.
My data is, however, structured a bit different. As John Witherspoon already commented, the profit is not on the customer directly. We are loading the salesorders and on this level profit is available. Adjusting the expression to aggregate the profit up to the customer level can easily be done. Putting a rank on there isn't too difficult either. My calculated dimension looks as follows:
Aggr(Num(Rank(Sum({$<Scenario={Actual}>} [_Profit]), 4)), [Customer]))
However, my requirements specify that all customers need to be shown in the graph. This means also the customers without salesorders. Of course, these need to be ranked as would they have a profit = 0. I thought a simple putting 'show all values' to true or 'suppress missing' to false would be enough, but it isn't as simple apparently.
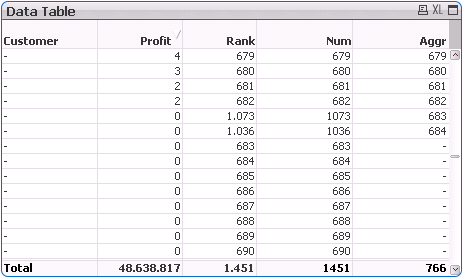
I have also tried to figger out how QlikView interpreted the above expression by breaking it down into separate expressions in a pivot (see screenshot below). For confidentiality reasons, I have blanked out the customer names. This pivot uses [Customer] as a dimension with 'show all values' set to true and the following expressions:
Profit: Sum({$<Scenario={Actual}>} [_Profit])
Rank: Rank(Sum({$<Scenario={Actual}>} [_Profit]), 4)
Num: Num(Rank(Sum({$<Scenario={Actual}>} [_Profit]), 4))
Aggr: Aggr(Num(Rank(Sum({$<Scenario={Actual}>} [_Profit]), 4)), [Customer]))
Apparently, the issue lies in the aggr-function itself. Although the inner part of the expression up to Num(...) returns results for all customers, the aggr-function just returns null for the customers without salesorders. Notice the difference between the two customers having salesorders and a profit of 0 (shown with rank and num(rank) of 1073 and 1074) and the ones without salesorders. The first do get an aggr(num(rank)) while the latter just get null.
Simply using the num-expression above as a dimension does not work. For a dimension, you apparently need the aggr-function.
Help is very much appreciated. Thanks.
Regards,
Mike
- « Previous Replies
-
- 1
- 2
- Next Replies »
- Mark as New
- Bookmark
- Subscribe
- Mute
- Subscribe to RSS Feed
- Permalink
- Report Inappropriate Content
Hi Mike,
it's often best to share a qlikview app to discuss the problem. I understand that your data is confidential, so I tried to build a very simple example and have this attached.
Customer A has no _Profit record.
As you can see, I managed to also include this customer in the charts. You said you have checked the appropriate options to hide / show the zero values (I assume also on the presentation tab).
I assume that my data model is not correct with regard to yours (for example I have not aggregated the _Profit from a finer Level of granularity before, like you mentioned (but haven't seen this in your code either)), so maybe you could just try to reproduce your model and show up the issue within the sample app?
An aggr() expression will also show a '-' as value n a chart expression, if it returns multiple values for the row. Please check (e.g. with count(), concat() if this is the case.
Regards,
Stefan
- Mark as New
- Bookmark
- Subscribe
- Mute
- Subscribe to RSS Feed
- Permalink
- Report Inappropriate Content
Hi Stefan,
Thanks already for your input. I have attached an extract of my QlikView app containing scrambled data which demonstrates my issue.
As you will notice for jan-jul 2011, the chart only shows 55 customers while in total there are 106. The difference are customers who have no actuals in the selected timerange. However, I would like to see them in the chart as well (as I do in the table at the bottom).
Regards,
Mike
[ATTACHMENT REMOVED]
- Mark as New
- Bookmark
- Subscribe
- Mute
- Subscribe to RSS Feed
- Permalink
- Report Inappropriate Content
Mike,
unfortunately it says access denied on opening your app.
Could you recheck the integrity / security settings?
Regards,
Stefan
- Mark as New
- Bookmark
- Subscribe
- Mute
- Subscribe to RSS Feed
- Permalink
- Report Inappropriate Content
Stefan,
I removed the 'initial data reduction based on section access' check in the document properties opening tab. Hope this is enough to allow you to open the document. If not, what else do I need to change?
Regards,
Mike
[ATTACHMENT REMOVED]
- Mark as New
- Bookmark
- Subscribe
- Mute
- Subscribe to RSS Feed
- Permalink
- Report Inappropriate Content
You are using section access with NT-Based authorization, right?
It would be best if you disable / remove the section access completely.
Stefan
- Mark as New
- Bookmark
- Subscribe
- Mute
- Subscribe to RSS Feed
- Permalink
- Report Inappropriate Content
Ok, I reloaded the data without the section access. Hope it works now.
Since I had to do the data reduction and scrambling again, the numbers are a little different now. The chart now shows 12 customers while in total there are 51. The difference are customers who have no actuals in the selected timerange. However, I would like to see them in the chart as well (as I do in the table at the bottom).
- Mark as New
- Bookmark
- Subscribe
- Mute
- Subscribe to RSS Feed
- Permalink
- Report Inappropriate Content
Ok,
open works now.
So I selected 2011, Jan-Jul, Customer and gross sales.
I see 12 Customers, but also in the two tables and if I put =count(Customer) in a text box.
So I guess your problem is that my selections limits the actual selection to these 12 customers, that's the problem, not the aggr etc stuff.
Have to think,
Stefan
P.S. I have to correct myself, I think I see now your 51 also in the tables.
edited by swuehl
- Mark as New
- Bookmark
- Subscribe
- Mute
- Subscribe to RSS Feed
- Permalink
- Report Inappropriate Content
I still agree with you that the date range selection will disregard the other customers. After all, you use customer as dimension in your aggregation and the aggregation will be executed in the context. You could change the set for the aggr expression, but that will invalidate the ranking, I believe.
Hm, I would try to maybe create a duplicate customer table just as dimension for charting, this is unconnected and will not be affected by selections. For the expressions you then need to pass the "customer2" value over to your complete data set like sum(if(customer=customer2, profit)).
Not sure if this works, just an idea.
Regards,
Stefan
- Mark as New
- Bookmark
- Subscribe
- Mute
- Subscribe to RSS Feed
- Permalink
- Report Inappropriate Content
That seems like a pretty heavy construction, especially since I have made this chart dynamically (as you probably have noticed). That would mean I need to duplicate every dimension in the model (and there are quite a few in there).
I still cannot really understand why the aggr-function eliminates these customers. It receives data existing for all customers since the num(rank(...)) is there for the ones out of the context also. I also cannot quite understand why the chart dimension does not accept the num(rank(...)) without the aggr around it.
Could I maybe use something different from the aggr-function to make the chart accept my rank as a dimension?
- « Previous Replies
-
- 1
- 2
- Next Replies »