Unlock a world of possibilities! Login now and discover the exclusive benefits awaiting you.
- Qlik Community
- :
- All Forums
- :
- QlikView App Dev
- :
- Re: How to highlight Background color across a bun...
- Subscribe to RSS Feed
- Mark Topic as New
- Mark Topic as Read
- Float this Topic for Current User
- Bookmark
- Subscribe
- Mute
- Printer Friendly Page
- Mark as New
- Bookmark
- Subscribe
- Mute
- Subscribe to RSS Feed
- Permalink
- Report Inappropriate Content
How to highlight Background color across a bunch of expressions
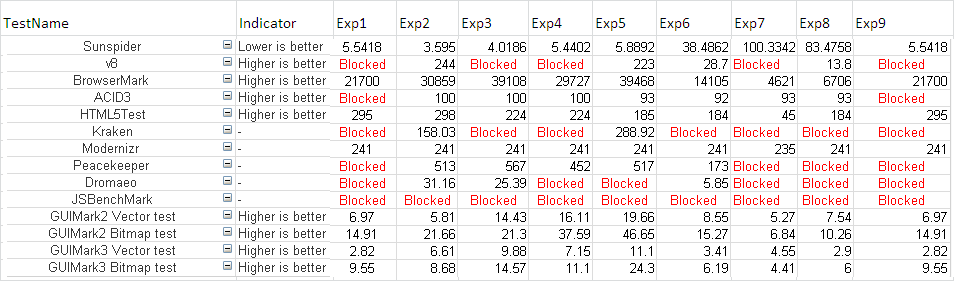
I have two dimension and 8 expressions in a pivot table.
I am trying to highlight the background color for the expression that has the highest value of all the expressions on each row for that dimension value (TestName). So, for Sunspider, it would be Exp7, I would want a blue background for that best one. I am not sure how to consider the 8 expressions columns on a row in the code as a set.
Anybody have any ideas how to do that?
- Tags:
- new_to_qlikview
- « Previous Replies
-
- 1
- 2
- Next Replies »
- Mark as New
- Bookmark
- Subscribe
- Mute
- Subscribe to RSS Feed
- Permalink
- Report Inappropriate Content
Jamie, nice, thanks....
- Mark as New
- Bookmark
- Subscribe
- Mute
- Subscribe to RSS Feed
- Permalink
- Report Inappropriate Content
Jamie,
How do you select the null entries to fill those?
- Mark as New
- Bookmark
- Subscribe
- Mute
- Subscribe to RSS Feed
- Permalink
- Report Inappropriate Content
Instead of doing the checking for missing data within the expression, I just told the Presentation tab of the object to put "Blocked" in the cell as opposed to "-". The problem here is that I'm not sure how to make those red.
- Mark as New
- Bookmark
- Subscribe
- Mute
- Subscribe to RSS Feed
- Permalink
- Report Inappropriate Content
Understood… Not quite sure either, must be a little thing I have off. Thanks….
- Mark as New
- Bookmark
- Subscribe
- Mute
- Subscribe to RSS Feed
- Permalink
- Report Inappropriate Content
Jamie,
In this case, Visual Clues - Text - Red will work since only text is the missing.
D
- Mark as New
- Bookmark
- Subscribe
- Mute
- Subscribe to RSS Feed
- Permalink
- Report Inappropriate Content
Perfect! Cheers
- « Previous Replies
-
- 1
- 2
- Next Replies »