Unlock a world of possibilities! Login now and discover the exclusive benefits awaiting you.
- Qlik Community
- :
- Forums
- :
- Analytics
- :
- New to Qlik Analytics
- :
- Re: Linechart show Top 2 based on an other (!) Key...
- Subscribe to RSS Feed
- Mark Topic as New
- Mark Topic as Read
- Float this Topic for Current User
- Bookmark
- Subscribe
- Mute
- Printer Friendly Page
- Mark as New
- Bookmark
- Subscribe
- Mute
- Subscribe to RSS Feed
- Permalink
- Report Inappropriate Content
Linechart show Top 2 based on an other (!) Keyfigure
Hi There,
My data looks like this:
Customer, Month, Value1, Value2
A,1,15,1
A,2,20,1
A,3,24,1
B,1,12,2
B,2,15,2
B,3,16,2
C,1,9,2
C,2,8,2
C,3,7,2
This data changes from time to time.
My goal is to show a linechart with the Dimension Customer and Month and the Keyfigure Value1. But I only want to show the top 2 customers based on Value2.
In my example the linechart should only show Customer B and C as the have the biggest Values for Value2.
I tried to create a dynamic dimension using if and rank, but this did not work as expected.
Do you have any idead how to solve this?
Thanks for your help!
- Mark as New
- Bookmark
- Subscribe
- Mute
- Subscribe to RSS Feed
- Permalink
- Report Inappropriate Content
I don't perfectly understand Qlik Sense, but this sort of works, but legend and color went away
Dimension
Month
=Aggr(If(Rank(Sum({<Category = {'Milk'}>}Value)) < 3, Customer), Customer)
Expression
Sum(
{<
Category = {'Bread'},
Customer = {"=Rank(Sum({<Category = {'Milk'}>}Value)) < 3"}
>}
Value)
Uncheck 'Include Null values' for the second dimension and keep 'Include Zero Values' from the Data Handling section
- Mark as New
- Bookmark
- Subscribe
- Mute
- Subscribe to RSS Feed
- Permalink
- Report Inappropriate Content
Hey Sunny,
that is a nice solution, but I am afraid, that this won't work for my project. Because the chart become pretty useless if I want to present top 4 and I do not have any color and legend that describes the line.
- Mark as New
- Bookmark
- Subscribe
- Mute
- Subscribe to RSS Feed
- Permalink
- Report Inappropriate Content
I knew this would be the case, but I guess I am not using Qlik Sense that much to give you solution to all possible things... I can give you work arounds, but I am sure you will find some issues with those also  ... I will make one last attempt... if you still don't like it, then some body else will have to help you.
Best,
Sunny
- Mark as New
- Bookmark
- Subscribe
- Mute
- Subscribe to RSS Feed
- Permalink
- Report Inappropriate Content
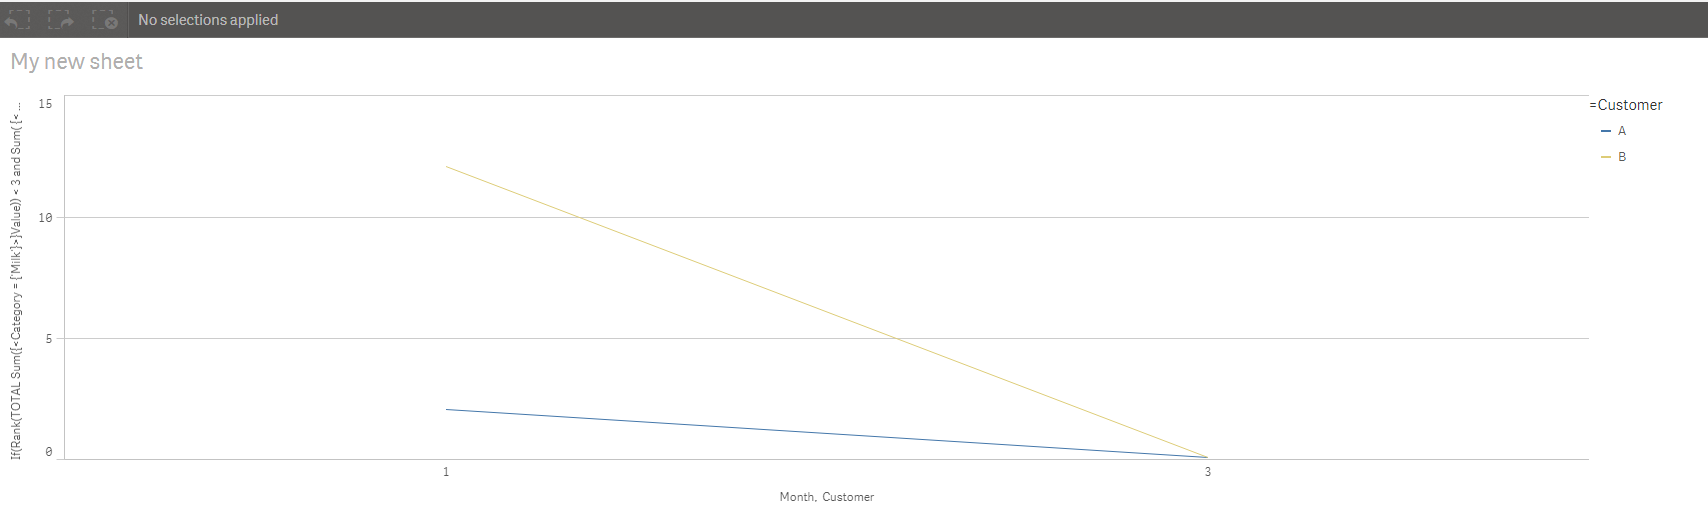
Try this expression
If(Rank(TOTAL Sum({<Category = {'Milk'}>}Value)) < 3 and Sum(
{<
Category = {'Bread'},
Customer = {"=Rank(Sum({<Category = {'Milk'}>}Value)) < 3"}
>}
Value) = 0, 0.000000001, Sum(
{<
Category = {'Bread'},
Customer = {"=Rank(Sum({<Category = {'Milk'}>}Value)) < 3"}
>}
Value))
and once again uncheck 'Include Zero Values' under Data Handling and change your dimension back from the calculated one to just Category.
- Mark as New
- Bookmark
- Subscribe
- Mute
- Subscribe to RSS Feed
- Permalink
- Report Inappropriate Content
Hey Sunny,
I really appreciate your help! But this solution is missing the values for the second month.
I guess I have to find another approach and maybe precalculate the values in the datamodel.
Thank you very very much! I will let you know if I find another solution!
All the best
Oliver
- Mark as New
- Bookmark
- Subscribe
- Mute
- Subscribe to RSS Feed
- Permalink
- Report Inappropriate Content
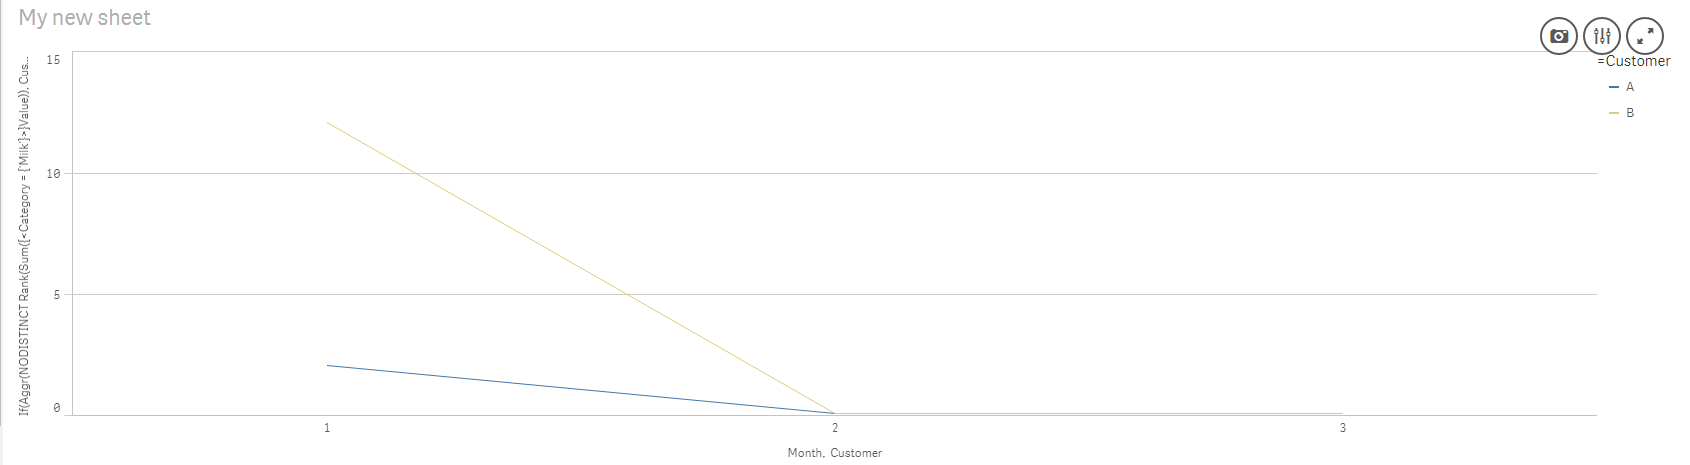
That was my bad, so yet another final try
If(Aggr(NODISTINCT Rank(Sum({<Category = {'Milk'}>}Value)), Customer) < 3 and Sum(
{<
Category = {'Bread'},
Customer = {"=Rank(Sum({<Category = {'Milk'}>}Value)) < 3"}
>}
Value) = 0, 0.000000001, Sum(
{<
Category = {'Bread'},
Customer = {"=Rank(Sum({<Category = {'Milk'}>}Value)) < 3"}
>}
Value))
- Mark as New
- Bookmark
- Subscribe
- Mute
- Subscribe to RSS Feed
- Permalink
- Report Inappropriate Content
Hey Sunny,
this really does not seem to be a normal feature in QS so I do not want to waste your time
This still is not the final resolution, as the bold marked items are now shown as zero instead of their actual values.
A,1,8,Bread
A,2,0,Bread
A,3,25,Milk
B,1,12,Bread
B,2,15,Milk
B,3,16,Milk
C,1,9,Milk
C,2,8,Bread
C,3,7,Bread
I will try to figure out something by myself and let you know if I get along with it.
- Mark as New
- Bookmark
- Subscribe
- Mute
- Subscribe to RSS Feed
- Permalink
- Report Inappropriate Content
But those are Milk, you specifically told your expression to look at Category = 'Bread'?
If(Aggr(NODISTINCT Rank(Sum({<Category = {'Milk'}>}Value)), Customer) < 3 and Sum(
{<
Category = {'Bread'},
Customer = {"=Rank(Sum({<Category = {'Milk'}>}Value)) < 3"}
>}
Value) = 0, 0.000000001, Sum(
{<
Category = {'Bread'},
Customer = {"=Rank(Sum({<Category = {'Milk'}>}Value)) < 3"}
>}
Value))
If you don't want that condition, may be you want to remove it?
- Mark as New
- Bookmark
- Subscribe
- Mute
- Subscribe to RSS Feed
- Permalink
- Report Inappropriate Content
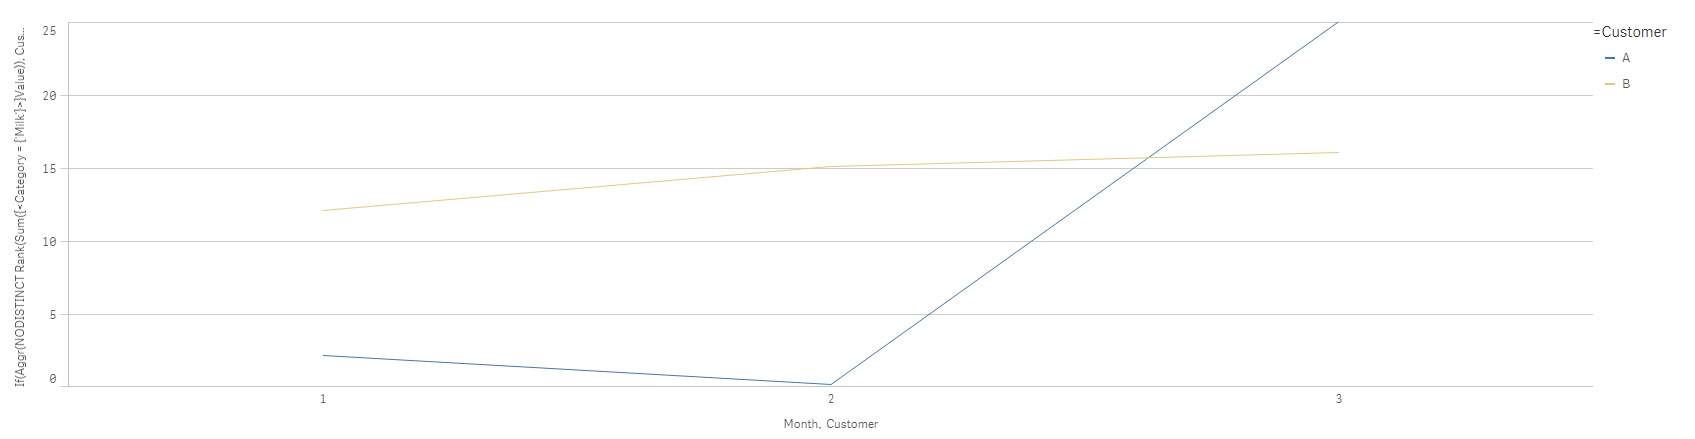
This is what I get when I use this expression
If(Aggr(NODISTINCT Rank(Sum({<Category = {'Milk'}>}Value)), Customer) < 3 and Sum(
{<
Customer = {"=Rank(Sum({<Category = {'Milk'}>}Value)) < 3"}
>}
Value) = 0, 0.000000001, Sum(
{<
Customer = {"=Rank(Sum({<Category = {'Milk'}>}Value)) < 3"}
>}
Value))
- Mark as New
- Bookmark
- Subscribe
- Mute
- Subscribe to RSS Feed
- Permalink
- Report Inappropriate Content
Also, as long as it is something related to numbers, you can continue to waste my time . It is Qlik Sense specific layout things and display things that I am not 100% sure about