Unlock a world of possibilities! Login now and discover the exclusive benefits awaiting you.
- Qlik Community
- :
- Forums
- :
- Analytics
- :
- New to Qlik Analytics
- :
- Maximum record with data (Qlik Sense)
- Subscribe to RSS Feed
- Mark Topic as New
- Mark Topic as Read
- Float this Topic for Current User
- Bookmark
- Subscribe
- Mute
- Printer Friendly Page
- Mark as New
- Bookmark
- Subscribe
- Mute
- Subscribe to RSS Feed
- Permalink
- Report Inappropriate Content
Maximum record with data (Qlik Sense)
Dear all,
I have the following data set:
Week Sales Forecast
1 500 400
2 400 400
3 100 150
4 425 450
5 (Null) 400
6 (Null) 400
Working with Qlik Sense, I need to create a line graph with two measures (cumulative sum of Sales and cumulative sum of Forecast) and one dimension (week). Week field is an integer ranging from 1 to 6. It does not come from any date field. Additionally, there is a week filter.
We are currently on week 5 so we have sales data only for the first four weeks. The cumulative sum of sales should range from 1 to 4 if no value was selected on the filter or the maximum selected value was higher than 4 and range from 1 to the maximum selected value if it was lower or equal than 4. If I type the following code ( =RangeSum(Above(Sum({<Week={">=1<=$(=(Max(Week)))"}>}Sales),0,RowNo())) ) and no value is selected on the filter,the sales line will range from 1 to 6, being the line horizontal from 4 to 6. It should finish on Week 4!!
Since there is Forecast data for every week, I have easily obtained the cumulative sum of Forecast by typing the following code:
=RangeSum(Above(Sum({<Week={">=1<=$(=(Max(Week)))"}>}Forecast),0,RowNo()))
I would really appreciate if anyone could help me solve this issue. Thank you very much in advance.
Best regards,
Gonzalo
- Tags:
- in qliksense
- null
- Mark as New
- Bookmark
- Subscribe
- Mute
- Subscribe to RSS Feed
- Permalink
- Report Inappropriate Content
Hi Gonzalo,
Is this what you mean?
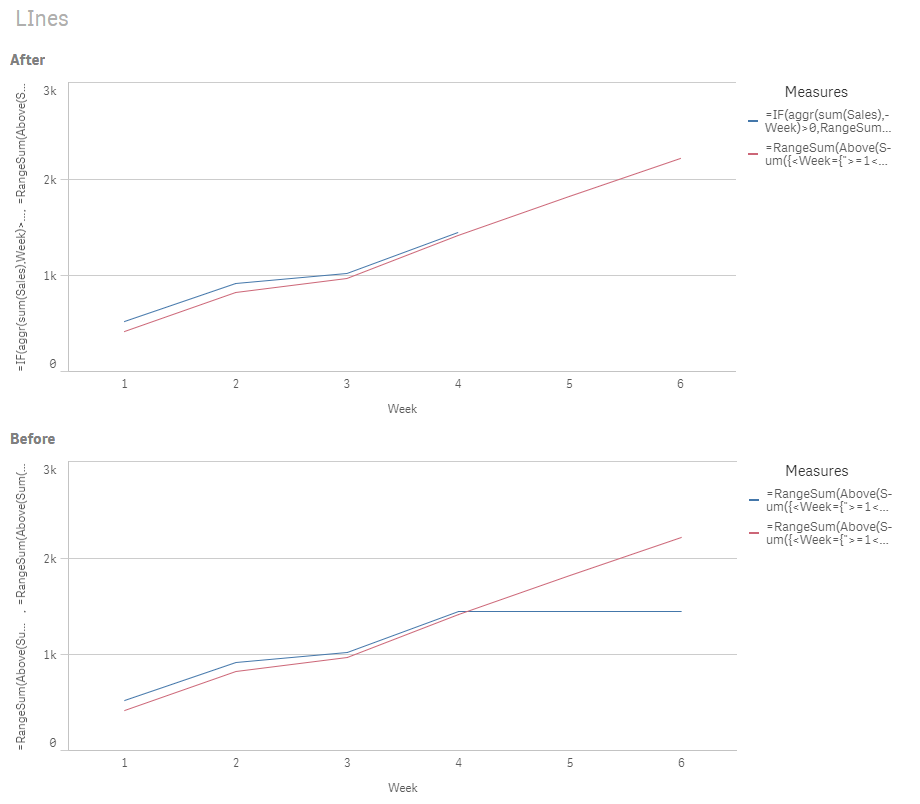
If that's the case you just need to change the Sales measure to something like this:
=IF(sum(Sales)>0,RangeSum(Above(Sum({<Week={">=1<=$(=(Max(Week)))"}>}Sales),0,RowNo())))
or just
=IF(Sales>0,RangeSum(Above(Sum({<Week={">=1<=$(=(Max(Week)))"}>}Sales),0,RowNo())))
I hope his helps,
Luis
- Mark as New
- Bookmark
- Subscribe
- Mute
- Subscribe to RSS Feed
- Permalink
- Report Inappropriate Content
Hi Luis,
Thank you very much for your reply! It's been very useful 
After applying the formula you said (without selecting any value on the Week filter), Sales and Forecast data is displayed properly (as you showed below).
Unfortunately, having applied this formula, if I select any value on the Week filter (let's say, for example, 4), the graph will show the cumulative sum of forecast from 1 to 4 as a line graph (that's perfect) but the cumulative sum of sales will be represented as a single point on Week 4. The value on Week 4 is correct, but sales should be represented as a line graph from 1 to 4 as well. Obviously, If I select Week5, no sales data will be displayed
As has been said previously, =RangeSum(Above(Sum({<Week={">=1<=$(=(Max(Week)))"}>}Forecast) formula was used for the cumulative sum of Forecast and it works well. It should not be the problem.
Thank you very much.
Best regards,
Gonzalo
- Mark as New
- Bookmark
- Subscribe
- Mute
- Subscribe to RSS Feed
- Permalink
- Report Inappropriate Content
Since null values appear on the Data Manager as -, I have tried to exclude them on the set analysis:
=RangeSum(Above(Sum({<Week={">=1<=$(=(Max(Week)))"},Sales-={"-"}>}Sales),0,RowNo()))
If I select any value on the Week filter (4, for example), it Works fine. Unfortunately, if no value is selected, it still displays cumulative sales data for week 5 and week 6.