Unlock a world of possibilities! Login now and discover the exclusive benefits awaiting you.
- Qlik Community
- :
- Forums
- :
- Analytics
- :
- App Development
- :
- Re: Qlik Sense conditional coloring based on highe...
- Subscribe to RSS Feed
- Mark Topic as New
- Mark Topic as Read
- Float this Topic for Current User
- Bookmark
- Subscribe
- Mute
- Printer Friendly Page
- Mark as New
- Bookmark
- Subscribe
- Mute
- Subscribe to RSS Feed
- Permalink
- Report Inappropriate Content
Qlik Sense conditional coloring based on highest values in column
Hello,
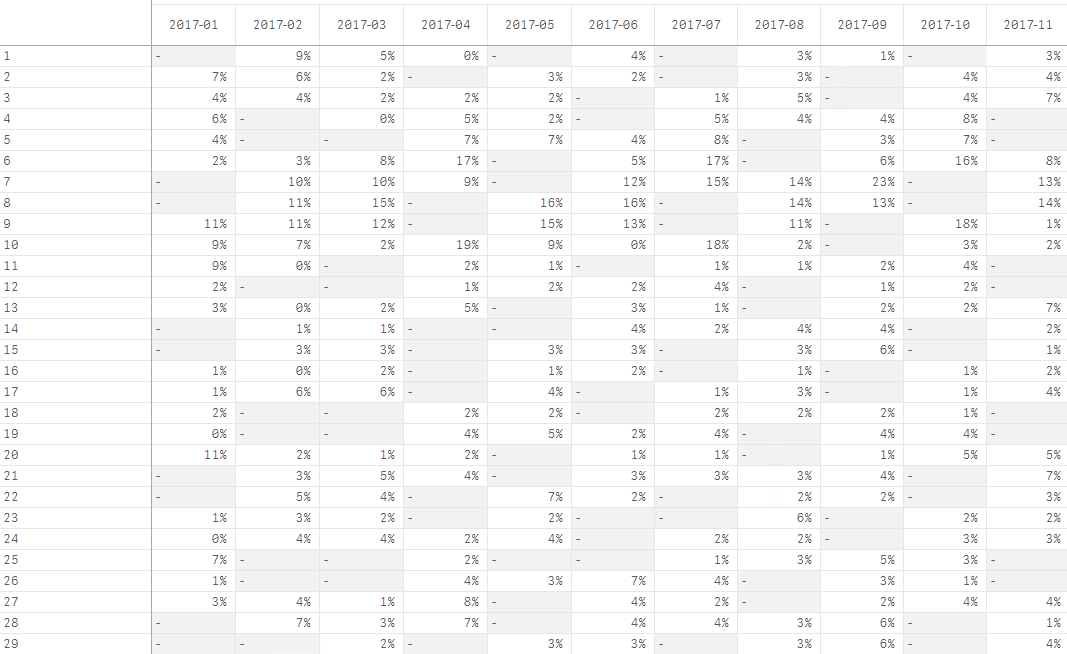
I would like to highlight the highest values in the columns of my pivot. (gradient from largest to smallest) How do i do that?
- Mark as New
- Bookmark
- Subscribe
- Mute
- Subscribe to RSS Feed
- Permalink
- Report Inappropriate Content
Hi Mikko,
Let's say your measure is called Sum(MeasureValue), and those numbers you have there from 1 to 29, let's call them RowID. And that you want the lowest in Red and the highest in Yellow,
Then you could use this formula on the colour expression (background or text)
=Colormix1(
(sum(MeasureValue)-$(=min(aggr( sum(MeasureValue), RowID))))/
$(=(max(aggr( sum(MeasureValue),RowID))-min(aggr( sum(MeasureValue),RowID)))),Red(),Yellow()
)
Cheers,
Luis
- Mark as New
- Bookmark
- Subscribe
- Mute
- Subscribe to RSS Feed
- Permalink
- Report Inappropriate Content
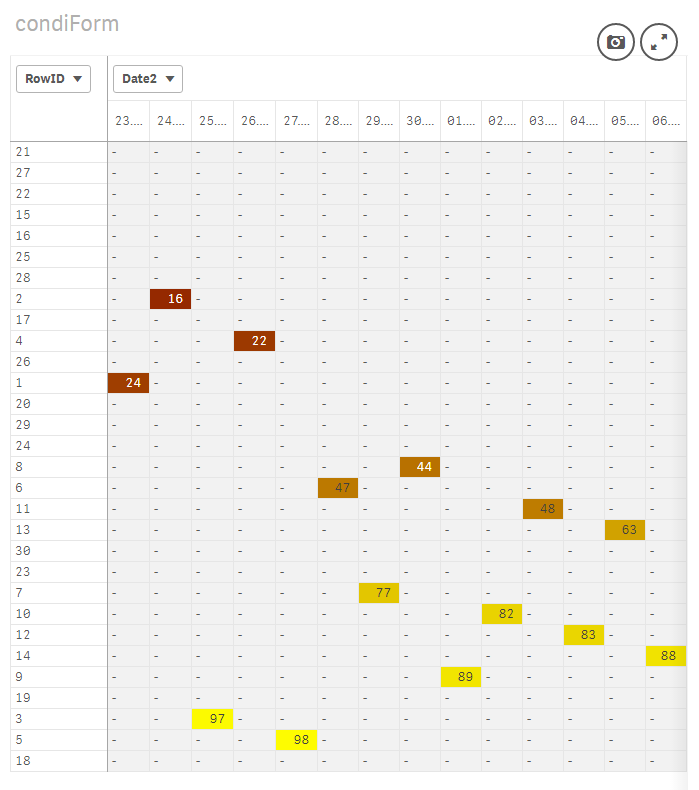
It'll look something like this:
I hope this helps,
Cheers,
Luis
- Mark as New
- Bookmark
- Subscribe
- Mute
- Subscribe to RSS Feed
- Permalink
- Report Inappropriate Content
Hi Mikko,
Have you been able to check it out?
Please let me know,
Luis
- Mark as New
- Bookmark
- Subscribe
- Mute
- Subscribe to RSS Feed
- Permalink
- Report Inappropriate Content
Hello,
not working. the measure value is an aggregated one and the row is day(date).
And as you see i have multiple values in one column and i want to highlight the values within the columns (high to low in column)
thanks
- Mark as New
- Bookmark
- Subscribe
- Mute
- Subscribe to RSS Feed
- Permalink
- Report Inappropriate Content
Hi,
Can you share sample data and your aggregation formula to see if I can reproduce?
Luis
- Mark as New
- Bookmark
- Subscribe
- Mute
- Subscribe to RSS Feed
- Permalink
- Report Inappropriate Content
Hi Mikko, which one?
- Mark as New
- Bookmark
- Subscribe
- Mute
- Subscribe to RSS Feed
- Permalink
- Report Inappropriate Content
Hi Mikko,
Please let me know if you're still interested in solving this one. If so, please share sample data and the expressions you're using to calculate dimensions and measures so I can adapt the color expression
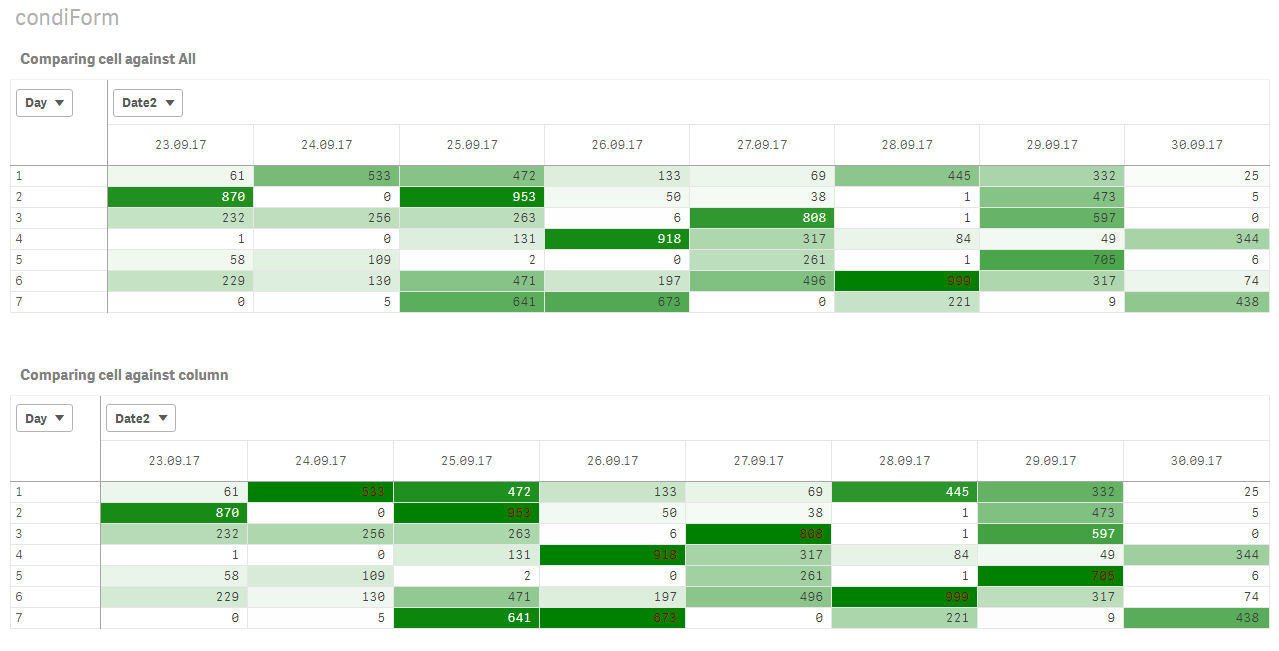
This is the expression I used for the second option (Comparing cell against column)
=Colormix1(
((sum(MeasureValue)-min(TOTAL <RowID> aggr(sum(MeasureValue),RowID,Date2)))
/ (max(TOTAL <RowID> aggr(sum(MeasureValue),RowID,Date2))
-min(TOTAL <RowID> aggr(sum(MeasureValue),RowID,Date2)))),White(),Green()
)
I hope this helps,
Cheers,
Luis
- Mark as New
- Bookmark
- Subscribe
- Mute
- Subscribe to RSS Feed
- Permalink
- Report Inappropriate Content
sorry, been busy. I will try out the latter option and let you know how it goes.