Unlock a world of possibilities! Login now and discover the exclusive benefits awaiting you.
- Qlik Community
- :
- Forums
- :
- Analytics
- :
- App Development
- :
- Re: how to show sum column wise in pivot table
- Subscribe to RSS Feed
- Mark Topic as New
- Mark Topic as Read
- Float this Topic for Current User
- Bookmark
- Subscribe
- Mute
- Printer Friendly Page
- Mark as New
- Bookmark
- Subscribe
- Mute
- Subscribe to RSS Feed
- Permalink
- Report Inappropriate Content
how to show sum column wise in pivot table
hello community,
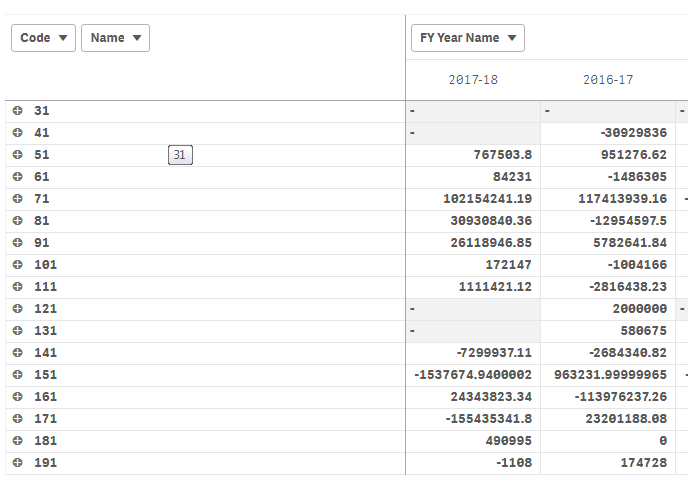
so here's my problem i want to show sum of amount based on the code and in the year name field
example:
code,name fy year name
2017-18
31 -
41 -
51 767503.8
61 84231
total of 51,61 851734.8
71 1021542..
81 309308
<and so on>
so can anyone help me how can i achieve this
for now my measure is simply sum(amount)
Please help me with this..
- Mark as New
- Bookmark
- Subscribe
- Mute
- Subscribe to RSS Feed
- Permalink
- Report Inappropriate Content
sum(aggr(sum({<code={31,41,51,61,71}>}amount),year))
hope this helps
- Mark as New
- Bookmark
- Subscribe
- Mute
- Subscribe to RSS Feed
- Permalink
- Report Inappropriate Content
yess thanks its true we are halfway there,
i used it this way :
sum({<Code={51,61}>}aggr(sum( {<Code={51,61}>} Amount),[FY Year Name]))
but its showing me the sum in the field of 51 - 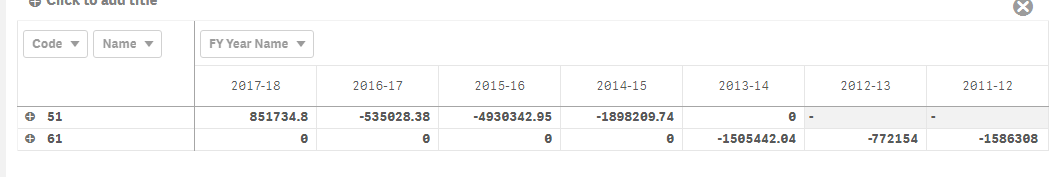
is there any way i can put total field horizontally below 61 in this table?
- Mark as New
- Bookmark
- Subscribe
- Mute
- Subscribe to RSS Feed
- Permalink
- Report Inappropriate Content
in the Dimension definition put if (match(code,'51','61'),'Total', code)
- Mark as New
- Bookmark
- Subscribe
- Mute
- Subscribe to RSS Feed
- Permalink
- Report Inappropriate Content
or you can add a new column in script
let's say Code_2
and you put if (match(code,'51','61'),Total,code) as Code_2
and in the chart you use Code_2 instead of Code