Unlock a world of possibilities! Login now and discover the exclusive benefits awaiting you.
- Qlik Community
- :
- Forums
- :
- Analytics
- :
- New to Qlik Analytics
- :
- Re: Linest_b, linest_m, tables and multiplications
- Subscribe to RSS Feed
- Mark Topic as New
- Mark Topic as Read
- Float this Topic for Current User
- Bookmark
- Subscribe
- Mute
- Printer Friendly Page
- Mark as New
- Bookmark
- Subscribe
- Mute
- Subscribe to RSS Feed
- Permalink
- Report Inappropriate Content
Linest_b, linest_m, tables and multiplications
Hi community,
a very fast question. I'm using the nice Linest_b function.
My dataset is something like:
load*inline
[a,x,y
a,3,4
b,4,5
c,5,9
d,7,1
];
So I need to have a table with this simple result
| a | x | y | y*beta |
|---|---|---|---|
| a | 3 | 4 | (x)-linest_b(x,y)-LINEST_M(x,y)*(y) |
| b | 4 | 5 | (x)-linest_b(x,y)-LINEST_M(x,y)*(y) |
| c | 5 | 9 | (x)-linest_b(x,y)-LINEST_M(x,y)*(y) |
| d | 7 | 1 | (x)-linest_b(x,y)-LINEST_M(x,y)*(y) |
But I cannot manage to have a result, everything goes grey. I've tried also to do something like
(x)-num(linest_b(x,y))-num(LINEST_M(x,y))*(y)
or
sum(x)-num(linest_b(x,y))-num(LINEST_M(x,y))*sum(y)
But nothing happened but to have an useless total.
Could I ask you an help?
Thanks in advance
EDIT:
Due further developements, it is, I'm using the model with y,x , not x,y. The reasoning are the same.
- « Previous Replies
-
- 1
- 2
- Next Replies »
- Mark as New
- Bookmark
- Subscribe
- Mute
- Subscribe to RSS Feed
- Permalink
- Report Inappropriate Content
Thanks Sunny (sorry for the delay),
but I need to have the solution alive, that is not possible to do it working on the load script. Those data are more simple than the real data, furthermore I'd like to have different regression at the variation of the selections.
There are some nice guide to bend a barplot to a histogram, but the problem is that I'd like to use the "new"features, being I hope more simple.
If they are not easy for their classical use (you know, histograms are used for the study of the residuals in a regression), probably I'm doing something wrong.
- Mark as New
- Bookmark
- Subscribe
- Mute
- Subscribe to RSS Feed
- Permalink
- Report Inappropriate Content
You want regression to change based on selection and yet you want it in the script? I am not sure how this would work.... May be someone else might have some good ideas for you 
- Mark as New
- Bookmark
- Subscribe
- Mute
- Subscribe to RSS Feed
- Permalink
- Report Inappropriate Content
No, sorry, I was not clear: only in selections. Everything is ok till now with your help, the only issue is to put the results of this
y-(linest_b( total y,x))-(LINEST_M(total y,x))*x
in a histogram.
- Mark as New
- Bookmark
- Subscribe
- Mute
- Subscribe to RSS Feed
- Permalink
- Report Inappropriate Content
What would the result look like? Would you be able to draw a picture with the numbers you expect to see?
- Mark as New
- Bookmark
- Subscribe
- Mute
- Subscribe to RSS Feed
- Permalink
- Report Inappropriate Content
Sure!
we have those data
# this is a "load*inline" in R:
x <- c(3,4,5,7)
y <- c(3,5,9,1)
# here the model in R
model <- lm(y~x)
#results intercept is the result of Qlik linest_b, x is the result of linest_m. (DONE!)
Coefficients:
(Intercept) x
6.9429 -0.5143
#here the residuals: the result is equal to the Qlik formula x-(linest_b( total x,y))-(LINEST_M(total x,y))*y (DONE!)
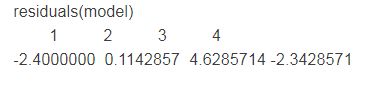
residuals(model)
1 2 3 4
-2.4000000 0.1142857 4.6285714 -2.3428571
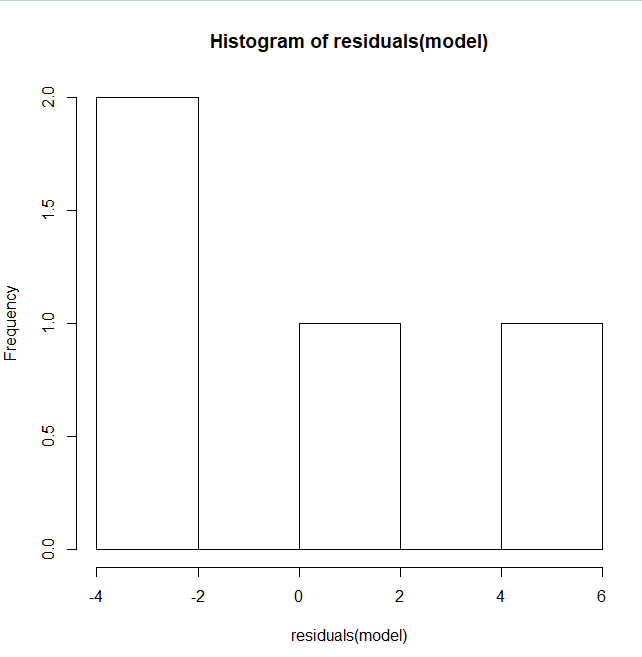
# Here what I want: an histogram of the residuals. i.e. (TO DO!)
hist(residuals(model))
With a quick and dirty result.
- Mark as New
- Bookmark
- Subscribe
- Mute
- Subscribe to RSS Feed
- Permalink
- Report Inappropriate Content
Trying to understand how you got this.
What exactly is 1, 2, 3, 4? Where did these values come from? I have not used this in a while, so you might have to explain a little more here
- Mark as New
- Bookmark
- Subscribe
- Mute
- Subscribe to RSS Feed
- Permalink
- Report Inappropriate Content
Sorry for the delay!
They indicate each point of the model, in this case we have four units, so there are four residuals (1,2,3,4).
Residuals (the values under 1,2,3,4) are the difference between the estimates value of the regression (i.e. the points of the line of the regression for each unit) and the real value of the points.
They are one of the thing to look at to see if the regression is a good model or a bad one. For exaple is useful to see if they are distributed like a Normal variable, and the easiest way (not perfect) is to put them in an Histogram.
The formula should be something like (in our case)
y-(6.9429)-(-0.5143)*x
In Qlik Sense
y-(linest_b( total y,x))-(LINEST_M(total y,x))*x // with your help
Where y and x are the data vector.
The result is the vector that you got after residuals(model).
(I'm going to edit some post, due I've inverted x and y in the model, but the reasoning is te same).
- Mark as New
- Bookmark
- Subscribe
- Mute
- Subscribe to RSS Feed
- Permalink
- Report Inappropriate Content
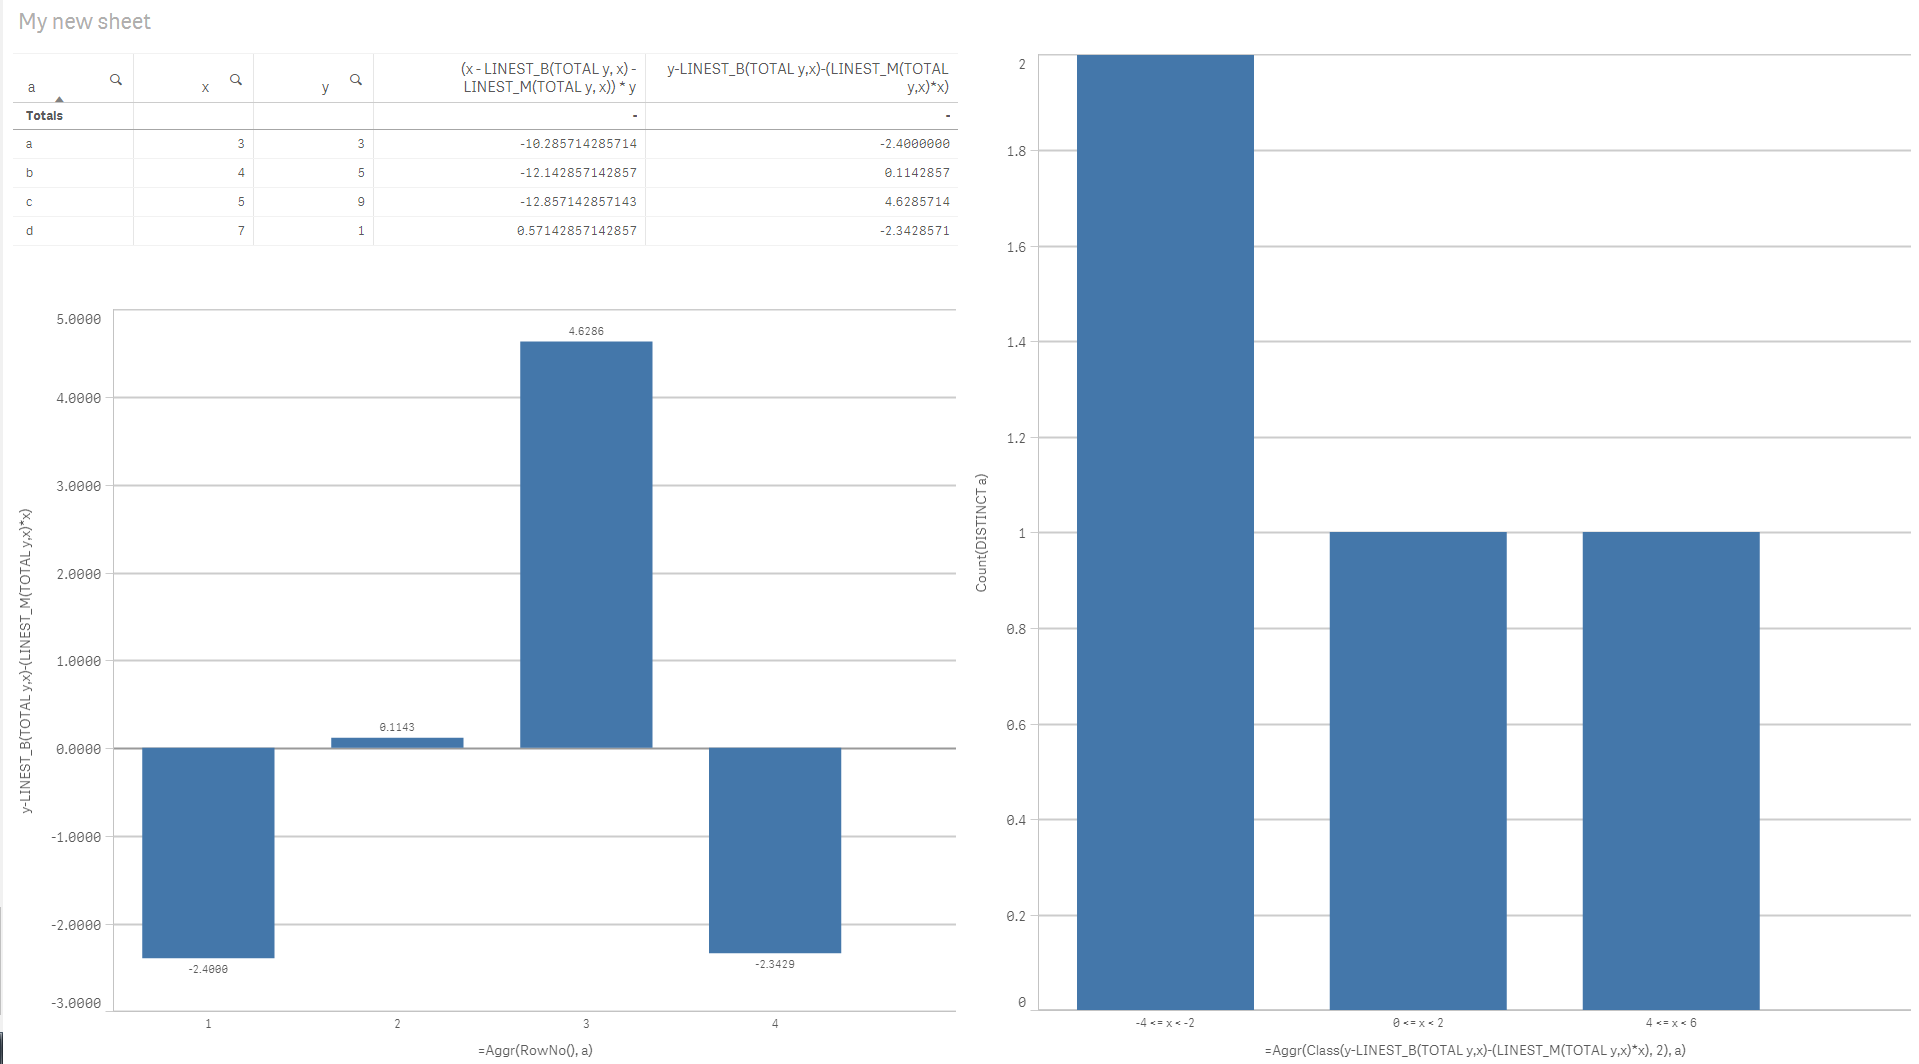
Check this out
- Mark as New
- Bookmark
- Subscribe
- Mute
- Subscribe to RSS Feed
- Permalink
- Report Inappropriate Content
This is pretty awesome, I knew it, but I having it in this post great. Also, if you add a simple variable and use the extension that allows to put inputs, you can vary the number of the class a bit more dynamically.
My idea is to use the official "histogram".
I'll use your idea, I need a result and it is great, but in your opinion, why using the histogram (official one) is so problematic? It is quite absurd to use such a "complex" workaround!
Thanks in advance for your patience and wide competence.
- Mark as New
- Bookmark
- Subscribe
- Mute
- Subscribe to RSS Feed
- Permalink
- Report Inappropriate Content
I am not too familiar with the new Qlik Sense chart, but it appears that Histogram works with a field rather than a calculated dimension. If it worked with calculated dimension, the problem would have easily resolved. May be this is something in the pipeline for Qlik... I don't really know....
- « Previous Replies
-
- 1
- 2
- Next Replies »