Unlock a world of possibilities! Login now and discover the exclusive benefits awaiting you.
- Qlik Community
- :
- Forums
- :
- Analytics
- :
- App Development
- :
- Re: Count minutes per Day/hour/Month,etc
- Subscribe to RSS Feed
- Mark Topic as New
- Mark Topic as Read
- Float this Topic for Current User
- Bookmark
- Subscribe
- Mute
- Printer Friendly Page
- Mark as New
- Bookmark
- Subscribe
- Mute
- Subscribe to RSS Feed
- Permalink
- Report Inappropriate Content
Count minutes per Day/hour/Month,etc
Dear Gurus,
I'm struggling to find a calculation that seems easy but I cannot find our how to reach it.
I have a pivot table with some Time dimensions (Month, Day, hours, etc) and some KPI's. I would like to add one KPI in this table to show me the total of minutes of my time selection. So, If I select "Day", I'd see in each colum: 1440 (24hours x 60 minutes). If I select Hour, I'd have to see 60*Number of selected Days. If I select Month, I'd have to see 43200 (30days -if that month has 30 days- x 24 hours x 60 minutes).
How can I reach this calculation? Thanks in advance!
Regards,
Jordi
- Mark as New
- Bookmark
- Subscribe
- Mute
- Subscribe to RSS Feed
- Permalink
- Report Inappropriate Content
what about
if(GetObjectField (1)='Date' ,14400,if(GetObjectField (1)='Month-Year_EN',43200,if(GetObjectField (1)='Hour',60)))
- Mark as New
- Bookmark
- Subscribe
- Mute
- Subscribe to RSS Feed
- Permalink
- Report Inappropriate Content
Yes, I attach an screenshot with how data looks like. The last KPI in the screenshot is the one I tried with Sum(Minutes). 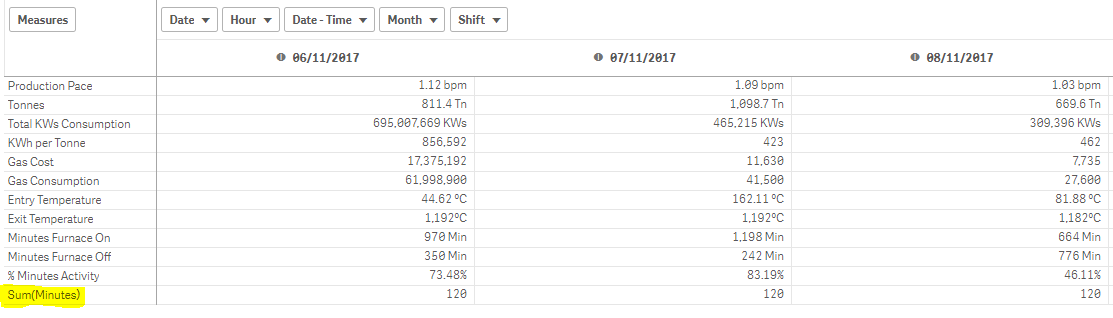
Thanks,
Regards,
Jordi
- Mark as New
- Bookmark
- Subscribe
- Mute
- Subscribe to RSS Feed
- Permalink
- Report Inappropriate Content
I have tried this. Now in all my selections, the result shown is 60. I seems like this formula is interpretating in all cases that my selection is "Hour".
I have made a test of it by typing:
if(GetObjectField (1)='Hour' ,1,2)
Just to check the behaviour, and I see that the result is always 1 whether if I select Hour, Date, Month...
- Mark as New
- Bookmark
- Subscribe
- Mute
- Subscribe to RSS Feed
- Permalink
- Report Inappropriate Content
add an extra column with GetObjectField (1) and check what you are getting .. you need to change the index inside the function to make it work your way . with a small tweaking in the code you can achieve this ..
a small app or a screenshot that can describe the structure and what dimension would be a plus.
- Mark as New
- Bookmark
- Subscribe
- Mute
- Subscribe to RSS Feed
- Permalink
- Report Inappropriate Content
I have seen that:
GetObjectField (1)='Hour'
GetObjectField (2)='Time'
GetObjectField (3)='Date'
GetObjectField (4)='Shift'
I'm going to try more possibilites with this clue...
- Mark as New
- Bookmark
- Subscribe
- Mute
- Subscribe to RSS Feed
- Permalink
- Report Inappropriate Content
you mentioned you are using alternate dimensions. you have to tweak your code to incorporate this my friend . share the screenshot of table with a few needed details to construct it and we will be able to help you better.
- Mark as New
- Bookmark
- Subscribe
- Mute
- Subscribe to RSS Feed
- Permalink
- Report Inappropriate Content
Well, it's not alternate dimensions as an in a graph that it's possible to switch them (I think this is what you meant); it's a pivot table where I can choose the dimension. I attached an screenshot in my last response to Sunny.
- Mark as New
- Bookmark
- Subscribe
- Mute
- Subscribe to RSS Feed
- Permalink
- Report Inappropriate Content
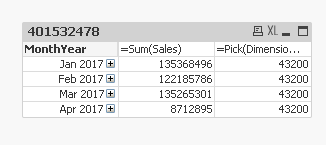
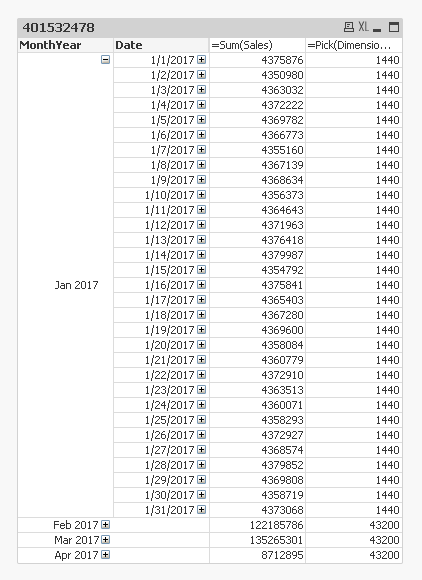
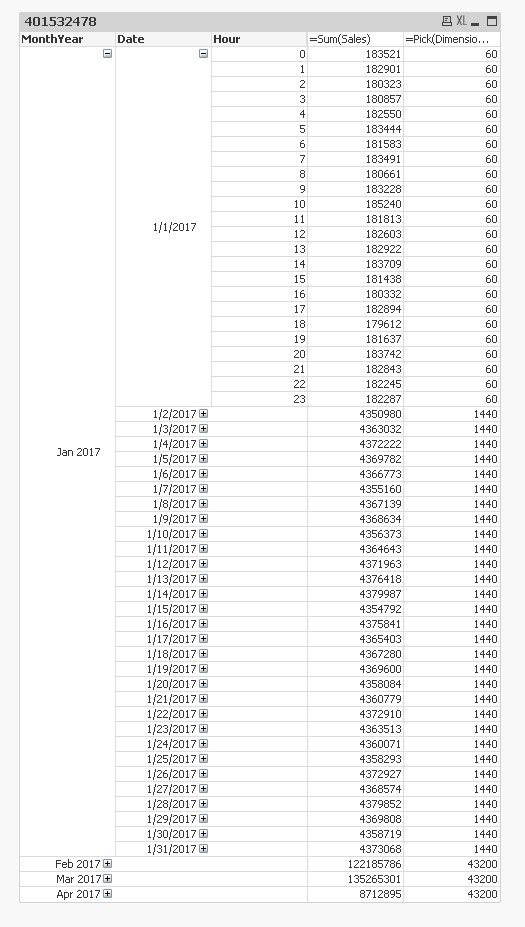
Try something like this
=Pick(Dimensionality(), 30*24*60, 24*60, 60)
You might have to fix the order of this based on your order of Dimensions, but you can see what I did
Dimension order
MonthYear - > Dimensionality() = 1
Date - > Dimensionality() = 2
Hour -> Dimensionality() = 3
When MonthYear is the main dimension
When Date is expanded
When Hour is expanded
Also note that if you are using pivoted dimension (which I don't think you are from your screenshot), you will have to use SecondaryDimensionality() instead of Dimensionality()
- Mark as New
- Bookmark
- Subscribe
- Mute
- Subscribe to RSS Feed
- Permalink
- Report Inappropriate Content
can you post a sample with dummy data and a sample output if possible.
i would try to try out a pivot with my data but it may not be the one you wanted. it would help if you could post a sample which resembles your pivot.
- Mark as New
- Bookmark
- Subscribe
- Mute
- Subscribe to RSS Feed
- Permalink
- Report Inappropriate Content
well i was going to suggest dimensionality() when got to know the dimensions are not alternate but stalwar1 is too quick for me!!