Unlock a world of possibilities! Login now and discover the exclusive benefits awaiting you.
- Qlik Community
- :
- Forums
- :
- Analytics
- :
- New to Qlik Analytics
- :
- Re: change bar colors in bar chart
- Subscribe to RSS Feed
- Mark Topic as New
- Mark Topic as Read
- Float this Topic for Current User
- Bookmark
- Subscribe
- Mute
- Printer Friendly Page
- Mark as New
- Bookmark
- Subscribe
- Mute
- Subscribe to RSS Feed
- Permalink
- Report Inappropriate Content
change bar colors in bar chart
Hi All,
How to change bar colors in bar chart By Expression.(Qliksense)
Dimension: AffectedApplication
Measure 1:
=if(GetSelectedCount(Affected_Month)>0,Round(Sum([Overall Availability%])/Count([Overall Availability%]))&''& '%',Only({<Affected_Date={'$(=Max(Affected_Date))'}>}[Overall Availability%])&''& '%')
Measure 2:
=if(GetSelectedCount(Affected_Month)>0,
Round(Sum([Unavailability%])/Count([Unavailability%]))&''& '%',
Only({<Affected_Date={'$(=Max(Affected_Date))'}>}[Unavailability%])&''& '%')
I need green for 1st measure and blue for 2nd measure.
Regards,
Krishna
Accepted Solutions
- Mark as New
- Bookmark
- Subscribe
- Mute
- Subscribe to RSS Feed
- Permalink
- Report Inappropriate Content
Hi,
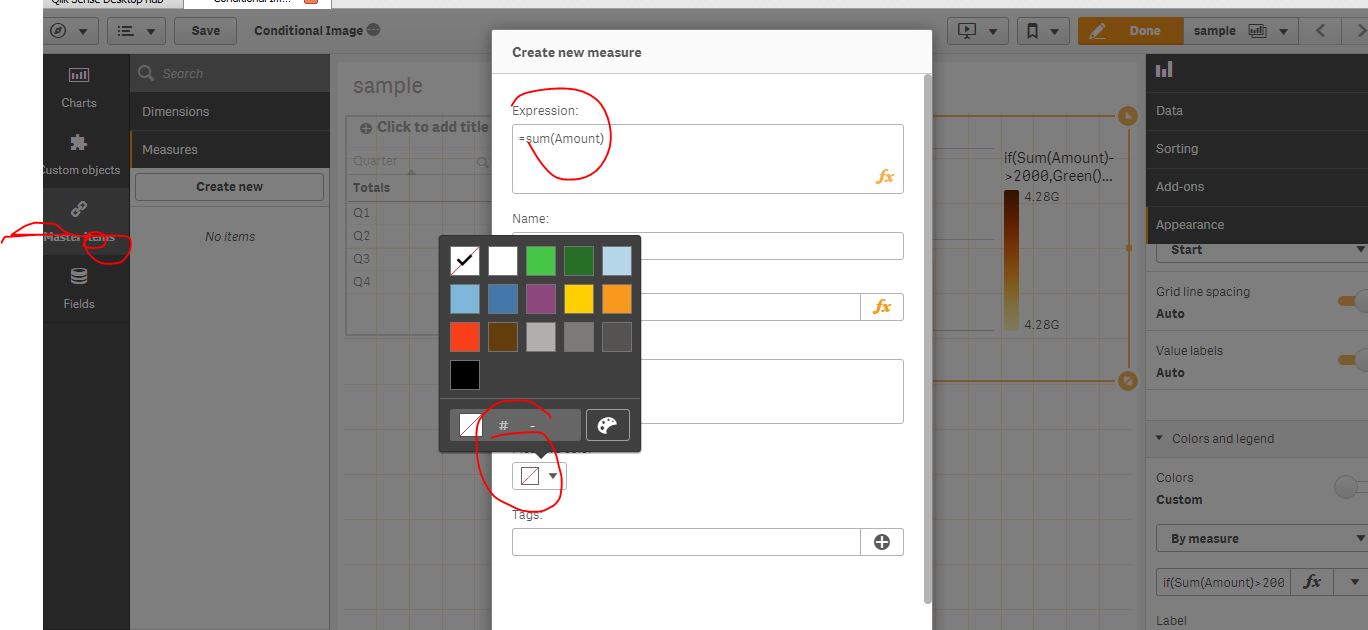
Create the Expression in Master Item and assign the color for each expression
- Mark as New
- Bookmark
- Subscribe
- Mute
- Subscribe to RSS Feed
- Permalink
- Report Inappropriate Content
Hi,
Create the Expression in Master Item and assign the color for each expression
- Mark as New
- Bookmark
- Subscribe
- Mute
- Subscribe to RSS Feed
- Permalink
- Report Inappropriate Content
Hi,
try below method,
method 1: try to create your measure as master item (in this master item we can assign measure color)
method: try to apply color by expression option in your chart -->presentation--> color & legends --select custom color (by measure option)
Color by expression ‒ Qlik Sense