Unlock a world of possibilities! Login now and discover the exclusive benefits awaiting you.
- Qlik Community
- :
- Forums
- :
- Analytics
- :
- New to Qlik Analytics
- :
- Re: Ranking products based on each line (measure) ...
- Subscribe to RSS Feed
- Mark Topic as New
- Mark Topic as Read
- Float this Topic for Current User
- Bookmark
- Subscribe
- Mute
- Printer Friendly Page
- Mark as New
- Bookmark
- Subscribe
- Mute
- Subscribe to RSS Feed
- Permalink
- Report Inappropriate Content
Ranking products based on each line (measure) of a Du Pont Analysis
Hi Guys,
I have a pivot table for a Du Pont Analysis to allow me to look at performance of different products across a province/suit (geographical area).
I run a similar exercise in Excel where I ranked the products in a single province, or provinces for a single product, from where I then created a radar diagram.
Below the Du Pont analysis set up for me by an advanced Qlik user.
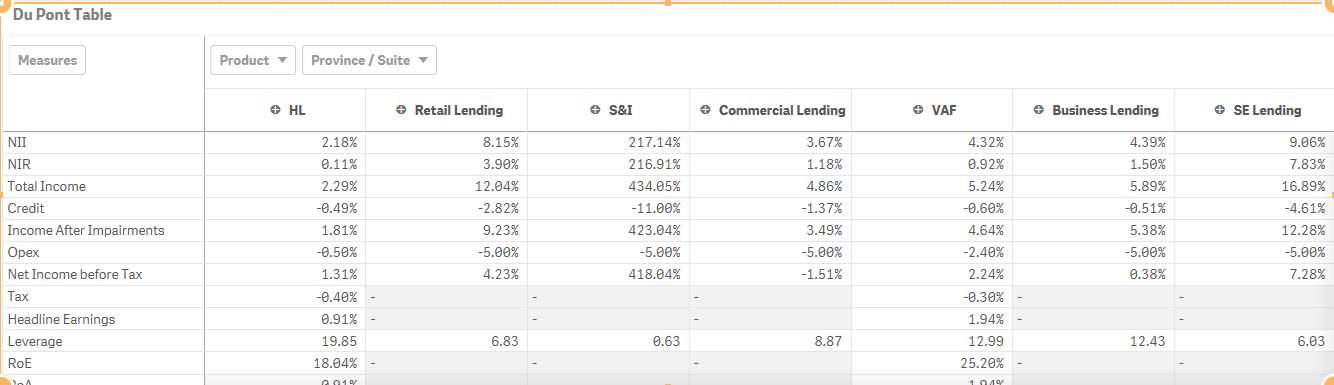
Looking at the basic RANK-function I get confused as to how to apply it as the syntax behind every Du POnt measure is quite advanced for me.
Please let me know what additional information I can provide to assist in creating a solution.
Kind regards, and happy holidays.
Johan
Accepted Solutions
- Mark as New
- Bookmark
- Subscribe
- Mute
- Subscribe to RSS Feed
- Permalink
- Report Inappropriate Content
- Mark as New
- Bookmark
- Subscribe
- Mute
- Subscribe to RSS Feed
- Permalink
- Report Inappropriate Content
I am not really sure what your issue is? Did you not understand what the advanced qlik user did or are you unable to get something you desire?
- Mark as New
- Bookmark
- Subscribe
- Mute
- Subscribe to RSS Feed
- Permalink
- Report Inappropriate Content
Hi Sunny,
Thank you for your reply.
I’m trying to use the ranking function but need help with it.
I want to look at a certain product, for example HL, and rank the provinces from 1 (best performer) to 7 (worst performer) based on some of the measures, for example NII, NIR, Credit, Headline Earnings and ROE.
The table below shows the selected product HL and its performance across the different provinces. An example of the measures - NII - this is based on the following (if that is helpful):
(Sum({<Year_Month = {'$(=$(vMaxYearMonth))'}>}YTD_NII)/vMaxMonth*12)
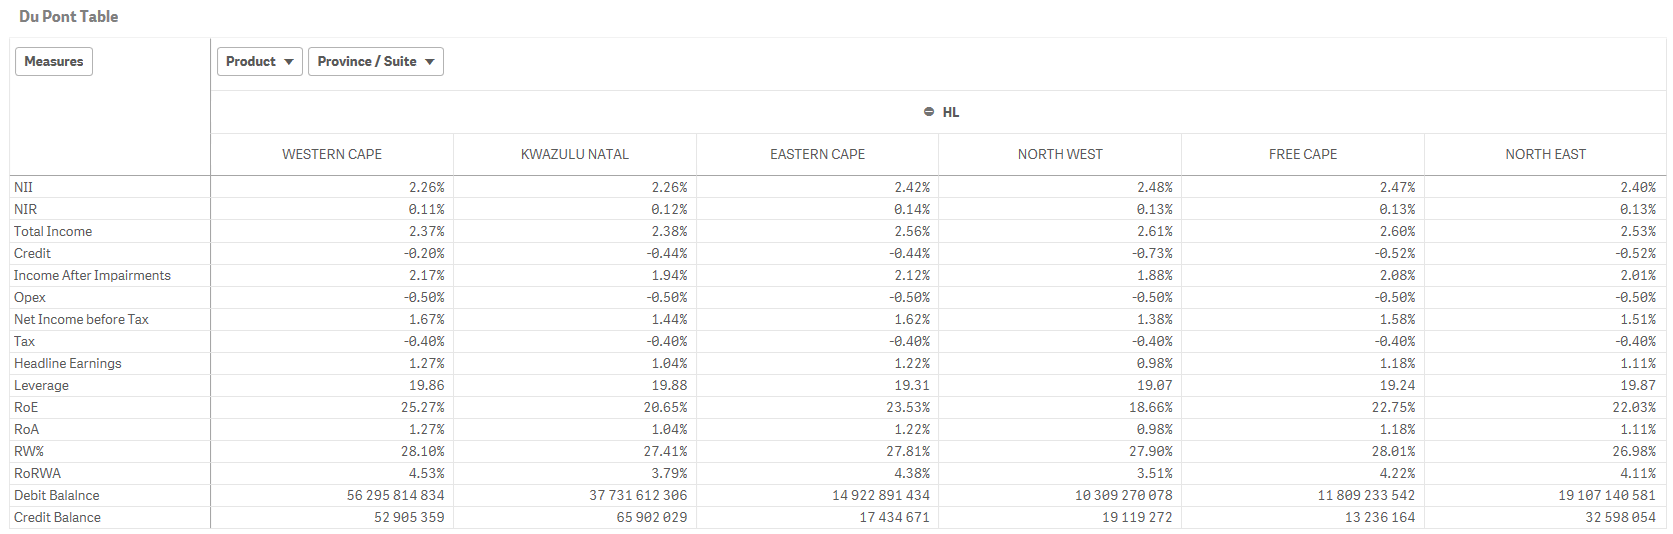
My aim is then to get a similar looking table just showing a ranking for the respective provinces from 1 to 7, for each of the measures I select.
I hope this is enough context.
Thank you
Johan
- Mark as New
- Bookmark
- Subscribe
- Mute
- Subscribe to RSS Feed
- Permalink
- Report Inappropriate Content
I think your province dimension is pivoted and you might be using Rank function.... try using HRank instead of Rank and see if that works for you
- Mark as New
- Bookmark
- Subscribe
- Mute
- Subscribe to RSS Feed
- Permalink
- Report Inappropriate Content
Check here
- Mark as New
- Bookmark
- Subscribe
- Mute
- Subscribe to RSS Feed
- Permalink
- Report Inappropriate Content
Yes, it is a pivot table.
In my comment above I mentioned ranking for the respective provinces. I realized it would be more insightful for my purposes to select one province and rank the products in such province.
I have select a single province and applied the HRank function:
- I didn't use the TOTAL qualifier - it returned no values then;
- And playing with the mode and format also made no difference.
I applied the HRank function on a copy of the same pivot table as follows -
HRank((Sum({<Year_Month = {'$(=$(vMaxYearMonth))'}>}YTD_NII)/vMaxMonth*12))
However, the ranking does not appear to be correct as shown below:

and ranked as

I was expecting the ranking to be:
1 – S&I
2 – Card
3 – SE Lending
4 – Retail Lending
5 – Business Lending
6 – VAF
7 – HL
- Mark as New
- Bookmark
- Subscribe
- Mute
- Subscribe to RSS Feed
- Permalink
- Report Inappropriate Content
So the table above uses this expression?
(Sum({<Year_Month = {'$(=$(vMaxYearMonth))'}>}YTD_NII)/vMaxMonth*12)
and table below (the one with the rank) uses this?
HRank((Sum({<Year_Month = {'$(=$(vMaxYearMonth))'}>}YTD_NII)/vMaxMonth*12))
If it does, then I don't see a reason for it to not work... Would you be able to share a qvf sample to check this out?
- Mark as New
- Bookmark
- Subscribe
- Mute
- Subscribe to RSS Feed
- Permalink
- Report Inappropriate Content
Hi Sunny,
I noticed a part of the expression commented out (//) and after including it in the function the ranking came out correctly.
Thank you so much for your time in this regard.
Johan
- Mark as New
- Bookmark
- Subscribe
- Mute
- Subscribe to RSS Feed
- Permalink
- Report Inappropriate Content
Super 