Unlock a world of possibilities! Login now and discover the exclusive benefits awaiting you.
- Qlik Community
- :
- All Forums
- :
- QlikView App Dev
- :
- Re: Need to show weekly minimum average
- Subscribe to RSS Feed
- Mark Topic as New
- Mark Topic as Read
- Float this Topic for Current User
- Bookmark
- Subscribe
- Mute
- Printer Friendly Page
- Mark as New
- Bookmark
- Subscribe
- Mute
- Subscribe to RSS Feed
- Permalink
- Report Inappropriate Content
Need to show weekly minimum average
Hi,
Please find the attached excel data file. for my client the week starts from Tuesday and ends on Monday. I have to show last weeks minimum avg 'TpT Act based on summation' by the mould number. How can i derive the weeks based the data available. I am a bit confused. Please help me with the script or the application.
Thanks
Vishnu T
- Mark as New
- Bookmark
- Subscribe
- Mute
- Subscribe to RSS Feed
- Permalink
- Report Inappropriate Content
Also attaching the application that i have tried to create, but was not able to get weekly minimum average. Kindly help !
- Mark as New
- Bookmark
- Subscribe
- Mute
- Subscribe to RSS Feed
- Permalink
- Report Inappropriate Content
Which chart are we working with and what is the output you expect to see (numbers you think should show up)?
- Mark as New
- Bookmark
- Subscribe
- Mute
- Subscribe to RSS Feed
- Permalink
- Report Inappropriate Content
Hi Sunny,
I need to show the values in the straight table. I need to show the last weeks Mould no. Process wise which took lease minimum avg time.
- Mark as New
- Bookmark
- Subscribe
- Mute
- Subscribe to RSS Feed
- Permalink
- Report Inappropriate Content
What is the expected output in terms of the numerical output
- Mark as New
- Bookmark
- Subscribe
- Mute
- Subscribe to RSS Feed
- Permalink
- Report Inappropriate Content
Hi Sunny,
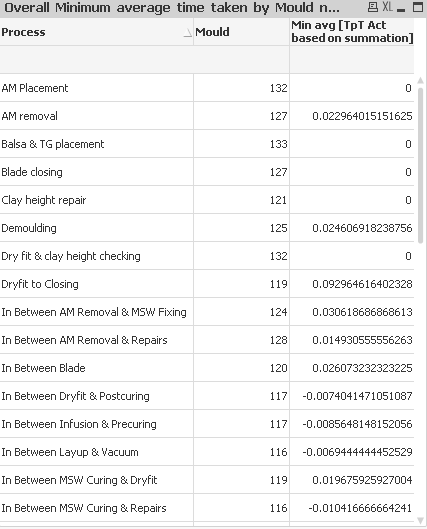
I need to show The Mould No which took Min avg time to produce blades process wise (Only for the last week).
Please find the below screen shot (For entire year) for the reference of Output.
- Mark as New
- Bookmark
- Subscribe
- Mute
- Subscribe to RSS Feed
- Permalink
- Report Inappropriate Content
Just looking at the AM Placement process, how do you know that Mould No 132 is the latest week's value? Why not 133? I am not sure I still understand what you are looking and how do you drive it
- Mark as New
- Bookmark
- Subscribe
- Mute
- Subscribe to RSS Feed
- Permalink
- Report Inappropriate Content
Hi Sunny,
I have considered process and Mould No as dimensions and I have derived min avg time by using 'min(Aggr(Avg([TpT Act based on summation]),Process,[Mould No]))'. and i have applied dimensions limits to Mould No to show the Smallest using the same expression in the dimension limits ('min(Aggr(Avg([TpT Act based on summation]),Process,[Mould No]))'). That is how i got the below output. Now i want to show the Last weeks Min average time process wise.
