Unlock a world of possibilities! Login now and discover the exclusive benefits awaiting you.
- Qlik Community
- :
- All Forums
- :
- QlikView App Dev
- :
- Re: How to sum the expression in Straight Table in...
- Subscribe to RSS Feed
- Mark Topic as New
- Mark Topic as Read
- Float this Topic for Current User
- Bookmark
- Subscribe
- Mute
- Printer Friendly Page
- Mark as New
- Bookmark
- Subscribe
- Mute
- Subscribe to RSS Feed
- Permalink
- Report Inappropriate Content
How to sum the expression in Straight Table instead of "Total Mode"
Hello,
Greetings for the day !
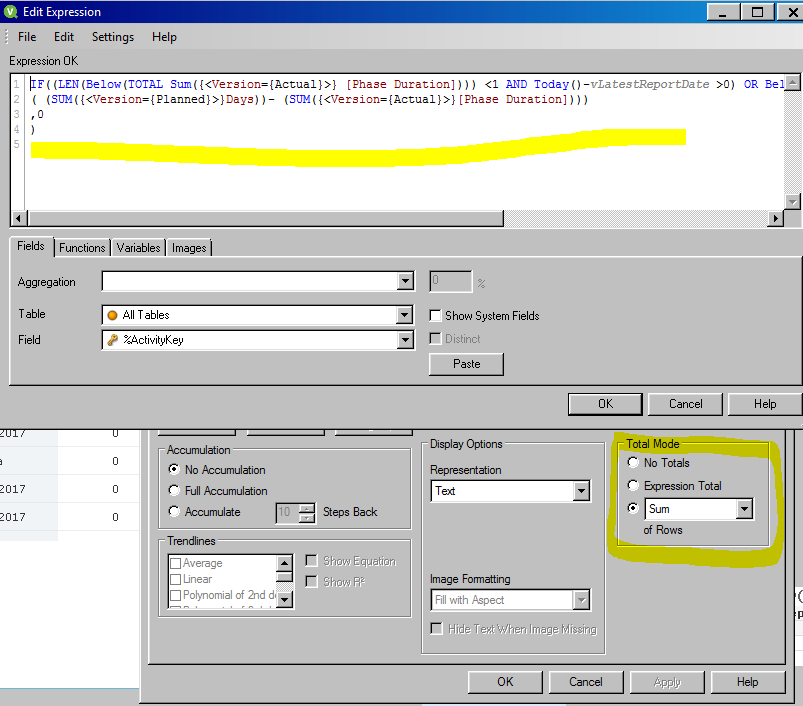
Please help on creating the below expression using sum instead of Total Mode in straight table as the same expression is being used for other objects in my dashboard (like : Text object , bar chart)
Expression :
IF((LEN(Below(TOTAL Sum({<Version={Actual}>} [Phase Duration]))) <1 AND Today()-vLatestReportDate >0) OR Below(TOTAL Sum({<Version={Actual}>} [Phase Duration])) >0 ,
( (SUM({<Version={Planned}>}Days))- (SUM({<Version={Actual}>}[Phase Duration])))
,0
)
Dimension : am using "Phase" and "Step No"
Thanks in advance.
Regards,
Bhargav
- Mark as New
- Bookmark
- Subscribe
- Mute
- Subscribe to RSS Feed
- Permalink
- Report Inappropriate Content
May be
Sum(Aggr(IF((LEN(Below(TOTAL Sum({<Version={Actual}>} [Phase Duration]))) <1 AND Today()-vLatestReportDate >0) OR Below(TOTAL Sum({<Version={Actual}>} [Phase Duration])) >0 ,
( (SUM({<Version={Planned}>}Days))- (SUM({<Version={Actual}>}[Phase Duration])))
,0), Phase, [Step No]))
- Mark as New
- Bookmark
- Subscribe
- Mute
- Subscribe to RSS Feed
- Permalink
- Report Inappropriate Content
Try this
Sum(Aggr(
If((Len(Below(TOTAL Sum({<Version={Actual}>} [Phase Duration]))) < 1 and Today()-vLatestReportDate >0) or Below(TOTAL Sum({<Version={Actual}>} [Phase Duration])) >0 ,
( (SUM({<Version={Planned}>}Days))- (SUM({<Version={Actual}>}[Phase Duration])))
,0
),
Phase, [Step No]))
UPDATE:
Only thing to be aware of now is to make sure that sorting of Aggr is not different from the sorting you have in your chart.... else the result will differ. The reason for this is because you are using Below function in your expression which depends on the sorting... it will behave differently if the sorting between the chart and your load script sorting is different to each other....
- Mark as New
- Bookmark
- Subscribe
- Mute
- Subscribe to RSS Feed
- Permalink
- Report Inappropriate Content
If you are using QV12 or above, you might be able to fix the sorting using this