Unlock a world of possibilities! Login now and discover the exclusive benefits awaiting you.
- Qlik Community
- :
- All Forums
- :
- QlikView App Dev
- :
- Re: One table, Two Date Fields and one Backlog
- Subscribe to RSS Feed
- Mark Topic as New
- Mark Topic as Read
- Float this Topic for Current User
- Bookmark
- Subscribe
- Mute
- Printer Friendly Page
- Mark as New
- Bookmark
- Subscribe
- Mute
- Subscribe to RSS Feed
- Permalink
- Report Inappropriate Content
One table, Two Date Fields and one Backlog
Hi all,
I am new in QLIK community and I am quite new in qlik experience. I have read the post "One table, Two Date Fields" ( https://community.qlik.com/thread/136729?_ga=2.147659761.733376340.1515509018-2108658744.1514547763 ) about the solution to show 2 date fields in the same Chart.
I have a similar problem, I have to show in a chart a incident log table with 3 columns (two date fields that can contain different dates):
- incident number
- incident open date
- incident close date
I need to create a chart in which, for each calendar day, I show the total count of opened and closed incident.
And this is simple, implementing the same solution described in the post "One table, Two Date Fields" (see Marco Wedelsolution).
But I need a new more element to show in the chart: the "incident backlog", I mean the historical number of incident "still open" for each day.
The formula is: "backlog day1" = "backlog day0" + "total count opened incident day 1" - "total count closed incident day 1"
I can't find out how to calculate this backlog.
Someone can help me?
Accepted Solutions
- Mark as New
- Bookmark
- Subscribe
- Mute
- Subscribe to RSS Feed
- Permalink
- Report Inappropriate Content
Hi,
one example using your sample data might be:
using [Date] as dimension and an expression like:
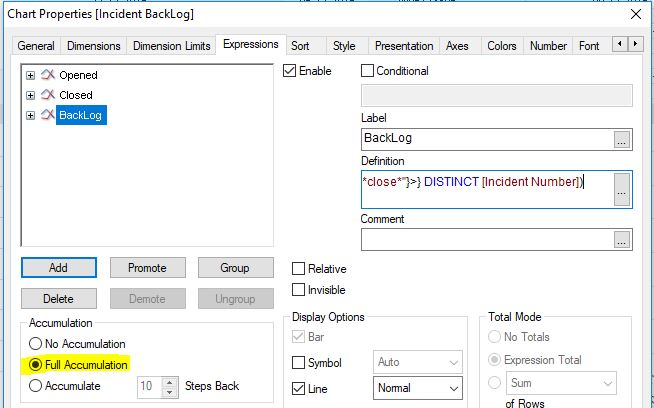
Count({$<IncidentTrend={"*open*"}>} DISTINCT [Incident Number])-Count({$<IncidentTrend={"*close*"}>} DISTINCT [Incident Number])
tabIncident:
LOAD [Incident Number],
    [Incident Open Date],
    If([Incident Close Date],[Incident Close Date]) as [Incident Close Date]
FROM [https://community.qlik.com/thread/287509] (html, codepage is 1252, embedded labels, table is @1);

tabLinkIncident:
CrossTable (IncidentTrend, Date)
LOAD [Incident Number],
    [Incident Open Date] as Opened,
    [Incident Close Date] as  Closed
Resident tabIncident;

tabCalendar:
LOAD *,
    Day(Date) as Day,
    WeekDay(Date) as WeekDay,
    Week(Date) as Week,
    WeekName(Date) as WeekName,
    Month(Date) as Month,
    MonthName(Date) as MonthName,
    Ceil(Month(Date)/3) as Quarter,
    QuarterName(Date) as QuarterName,
    Year(Date) as Year,
    WeekYear(Date) as WeekYear;
LOAD Date(MinDate+IterNo()-1) as Date
While MinDate+IterNo()-1<=MaxDate;
LOAD Min(Date) as MinDate,
    Max(Date) as MaxDate
Resident tabLinkIncident;
hope this helps
regards
Marco
- Mark as New
- Bookmark
- Subscribe
- Mute
- Subscribe to RSS Feed
- Permalink
- Report Inappropriate Content
Would you be able to provide some data with the expected output to help you better?
- Mark as New
- Bookmark
- Subscribe
- Mute
- Subscribe to RSS Feed
- Permalink
- Report Inappropriate Content
Hi Gianluca,
I think what you can do :
You can take second expression in the same chart as per the formula you shared above.
Then show your output by selecting Style tab in chart option with Stacked.
Hope this help you
Regards
Kamal
- Mark as New
- Bookmark
- Subscribe
- Mute
- Subscribe to RSS Feed
- Permalink
- Report Inappropriate Content
Hi!
First of all thanks for the support.
Here you can find some data and the script.
| Incident Number | Incident Open Date | Incident Close Date |
| IN05172126 | 02-12-2016 | 09-12-2016 |
| IN05172128 | 02-12-2016 | 12-12-2016 |
| IN05172647 | 02-12-2016 | 09-12-2016 |
| IN05173896 | 09-12-2016 | 12-12-2016 |
| IN05174315 | 09-12-2016 | 09-12-2016 |
| IN05174958 | 09-12-2016 | |
| IN05175035 | 09-12-2016 | 09-12-2016 |
| IN05175036 | 09-12-2016 | 09-12-2016 |
| IN05175036 | 09-12-2016 | 09-12-2016 |
| IN05176280 | 09-12-2016 | |
| IN05176522 | 09-12-2016 | 16-12-2016 |
| IN05176578 | 09-12-2016 | 18-01-2017 |
| IN05176763 | 09-12-2016 | |
| IN05176947 | 09-12-2016 | 08-03-2017 |
| IN05177252 | 09-12-2016 | 11-01-2017 |
| IN05177760 | 09-12-2016 | 20-12-2016 |
| IN05177833 | 09-12-2016 | 25-01-2017 |
| IN05191618 | 12-12-2016 | 12-12-2016 |
| IN05191639 | 12-12-2016 | 12-12-2016 |
| IN05191857 | 12-12-2016 | 12-12-2016 |
| IN05192677 | 12-12-2016 | |
| IN05193960 | 12-12-2016 | 27-12-2016 |
//////////////////////////////////////////////////////////////////////////////////////////////////////
tabIncident:
LOAD
[Incident Number],
[Incident Open Date] as Opened,
[Incident Close Date] as Closed
FROM
$(XLS_FILE)
(ooxml, embedded labels, table is Incident);
tabLinkIncident:
CrossTable (IncidentTrend, Date)
LOAD
[Incident Reference Number],
Opened,
Closed
Resident tabIncident;
tabCalIncident:
LOAD *,
Day(Date) as Day,
WeekDay(Date) as WeekDay,
Week(Date) as Week,
WeekName(Date) as WeekName,
Month(Date) as Month,
MonthName(Date) as MonthName,
Ceil(Month(Date)/3) as Quarter,
QuarterName(Date) as QuarterName,
Year(Date) as Year,
WeekYear(Date) as WeekYear;
LOAD Date(MinDate+IterNo()-1) as Date
While MinDate+IterNo()-1<=Today();
LOAD RangeMin(Min(Opened),Min(Closed)) as MinDate
Resident tabIncident;
//////////////////////////////////////////////////////////////////////////////////////////////////////
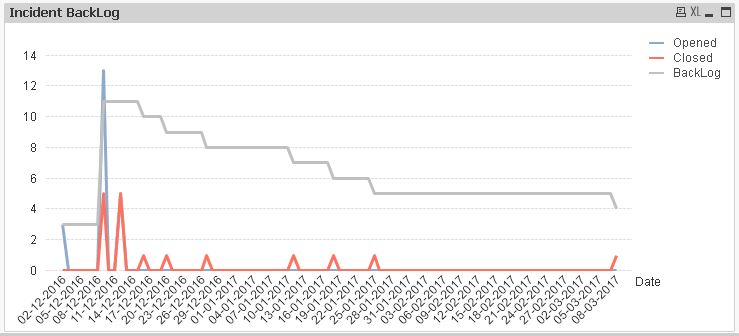
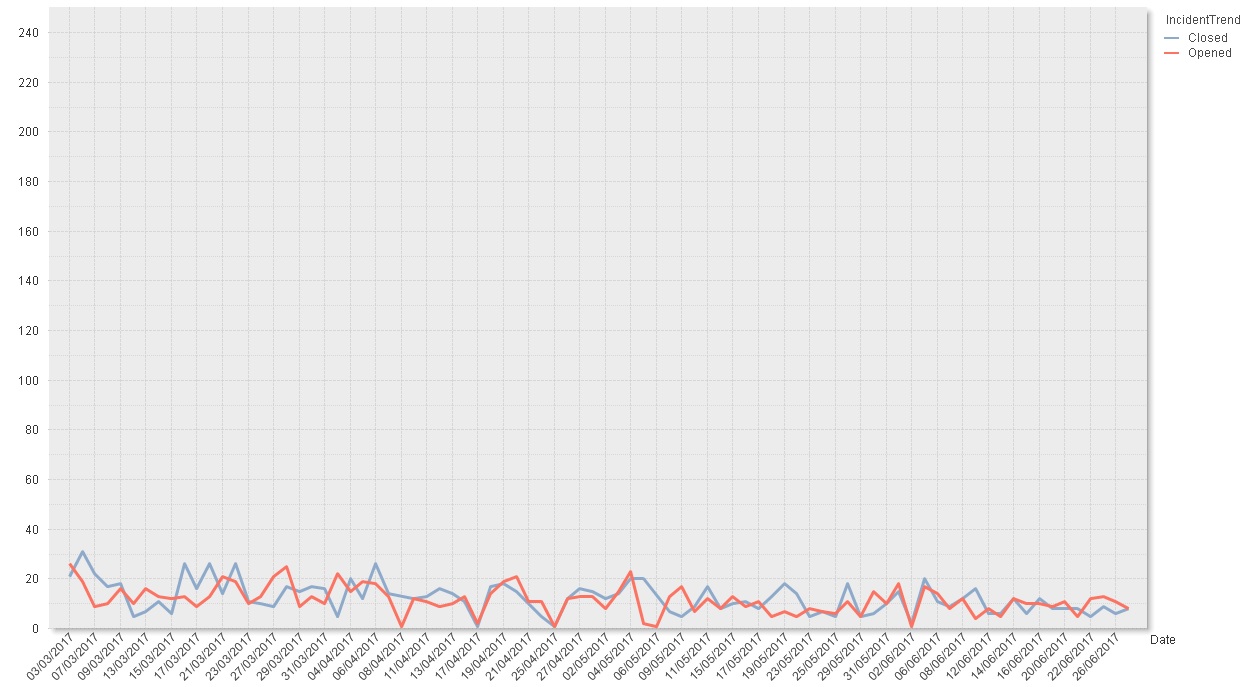
Here the Chart I did.
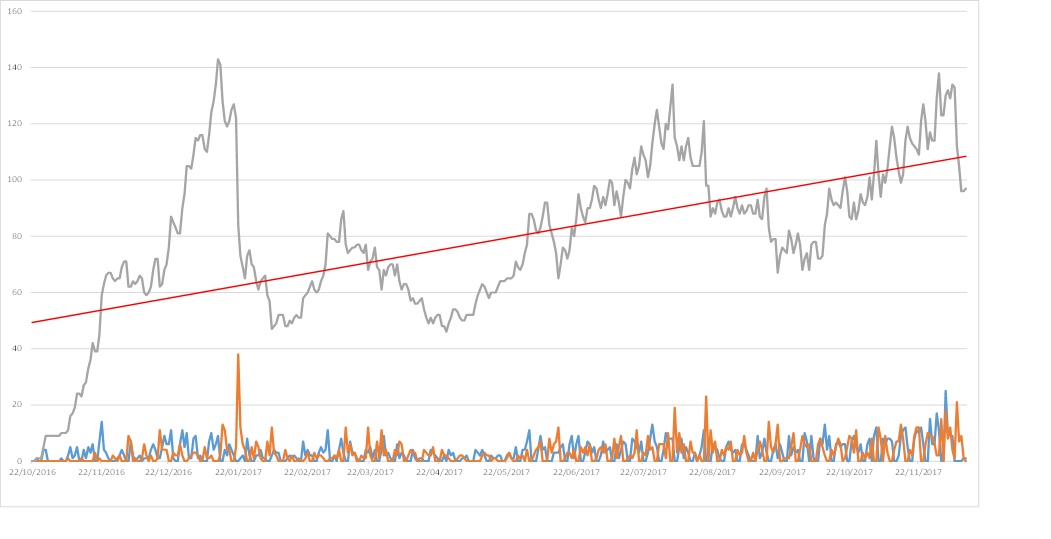
Here the Chart with the BackLog (grey line) I would like to obtain.
- Mark as New
- Bookmark
- Subscribe
- Mute
- Subscribe to RSS Feed
- Permalink
- Report Inappropriate Content
Hi,
one example using your sample data might be:
using [Date] as dimension and an expression like:
Count({$<IncidentTrend={"*open*"}>} DISTINCT [Incident Number])-Count({$<IncidentTrend={"*close*"}>} DISTINCT [Incident Number])
tabIncident:
LOAD [Incident Number],
    [Incident Open Date],
    If([Incident Close Date],[Incident Close Date]) as [Incident Close Date]
FROM [https://community.qlik.com/thread/287509] (html, codepage is 1252, embedded labels, table is @1);

tabLinkIncident:
CrossTable (IncidentTrend, Date)
LOAD [Incident Number],
    [Incident Open Date] as Opened,
    [Incident Close Date] as  Closed
Resident tabIncident;

tabCalendar:
LOAD *,
    Day(Date) as Day,
    WeekDay(Date) as WeekDay,
    Week(Date) as Week,
    WeekName(Date) as WeekName,
    Month(Date) as Month,
    MonthName(Date) as MonthName,
    Ceil(Month(Date)/3) as Quarter,
    QuarterName(Date) as QuarterName,
    Year(Date) as Year,
    WeekYear(Date) as WeekYear;
LOAD Date(MinDate+IterNo()-1) as Date
While MinDate+IterNo()-1<=MaxDate;
LOAD Min(Date) as MinDate,
    Max(Date) as MaxDate
Resident tabLinkIncident;
hope this helps
regards
Marco
- Mark as New
- Bookmark
- Subscribe
- Mute
- Subscribe to RSS Feed
- Permalink
- Report Inappropriate Content
another method could be to Creating Reference Dates for Intervals
in this case leading to easier chart expressions (without the need for in-chart accumulation) but increasing your application size.
hope this helps
regards
Marco
- Mark as New
- Bookmark
- Subscribe
- Mute
- Subscribe to RSS Feed
- Permalink
- Report Inappropriate Content
It works!!!
Marco, thank you very much.
- Mark as New
- Bookmark
- Subscribe
- Mute
- Subscribe to RSS Feed
- Permalink
- Report Inappropriate Content
you're welcome
please close your thread if your question is answered:
Qlik Community Tip: Marking Replies as Correct or Helpful
thanks
regards
Marco