Unlock a world of possibilities! Login now and discover the exclusive benefits awaiting you.
- Qlik Community
- :
- All Forums
- :
- QlikView App Dev
- :
- Re: Dimension Expression with aggregation grouping
- Subscribe to RSS Feed
- Mark Topic as New
- Mark Topic as Read
- Float this Topic for Current User
- Bookmark
- Subscribe
- Mute
- Printer Friendly Page
- Mark as New
- Bookmark
- Subscribe
- Mute
- Subscribe to RSS Feed
- Permalink
- Report Inappropriate Content
Dimension Expression with aggregation grouping
Hi All,
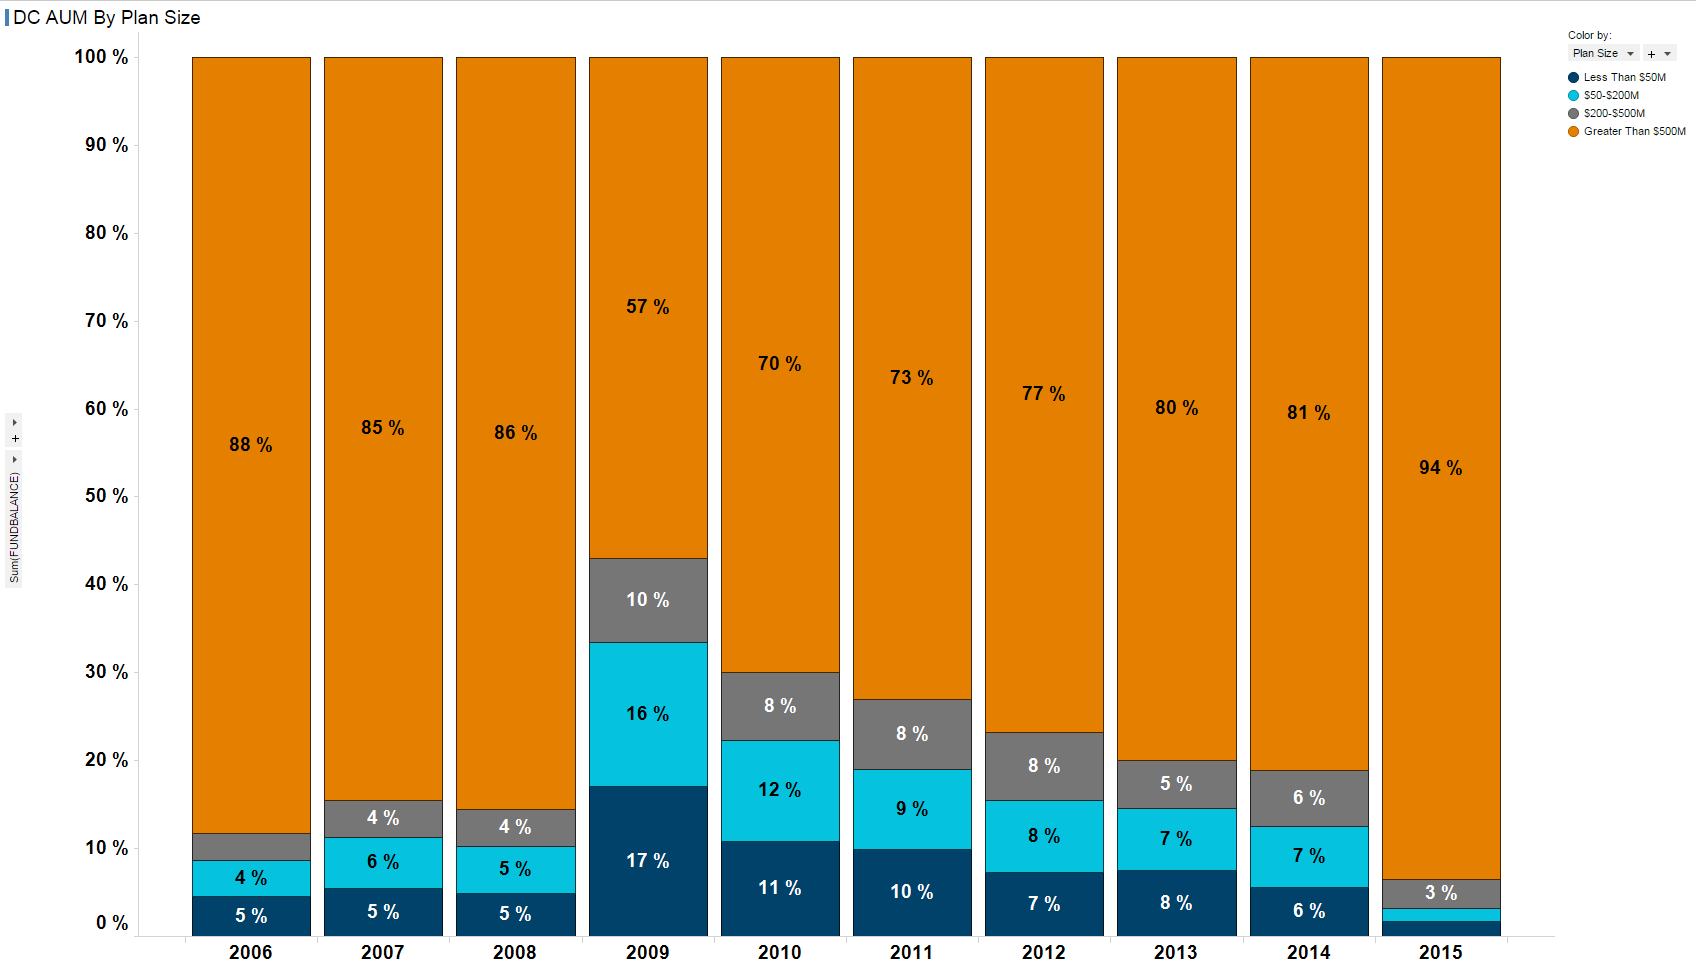
Hope you guys are doing fantastic. I have a simple requirement. Below is the simple Dimension Expression I want to add it to the 100% stacked Bar chart. Unfortunately, I am not getting the right results. Is something wrong with the expression?
=if(Aggr(Sum(FUNDBALANCE),COMPANY,PLANYEAR)>500000000 ,'Greater Than $500M',
if(Aggr(Sum(FUNDBALANCE),COMPANY,PLANYEAR)<50000000 ,'Less Than $50M',
if(Aggr(Sum(FUNDBALANCE),COMPANY,PLANYEAR)>=200000000 and Aggr(Sum(FUNDBALANCE),COMPANY,PLANYEAR)<500000000 ,'$200-$500M',
if(Aggr(Sum(FUNDBALANCE),COMPANY,PLANYEAR)>=50000000 and Aggr(Sum(FUNDBALANCE),COMPANY,PLANYEAR)<200000000 ,'$50-$200M'))))
Please find the attached image for reference. This logic is working fine in other BI tools like Tibco Spotfire but not sure how to build this one in Qlik Sense. A help would be much appreciated.
Thanks,
-Vidya
Accepted Solutions
- Mark as New
- Bookmark
- Subscribe
- Mute
- Subscribe to RSS Feed
- Permalink
- Report Inappropriate Content
Yes. Anil I was able to fix that issue.
Resolution:
I created the Plan Size dimension in script editor using a resident table.
In Front End
Dimension 1: PLAN YEAR
Dimension 2: PLANSIZE (This dimension I have created in Script editor as I mentioned)
Measure Expression: sum(FUNDBALANCE) / sum(total <PLANYEAR> FUNDBALANCE)
Result:

Thanks,
-Vidya
- Mark as New
- Bookmark
- Subscribe
- Mute
- Subscribe to RSS Feed
- Permalink
- Report Inappropriate Content
"I am not getting the right results"
So, This really tough to explain without having Data?
- Mark as New
- Bookmark
- Subscribe
- Mute
- Subscribe to RSS Feed
- Permalink
- Report Inappropriate Content
Hi All,
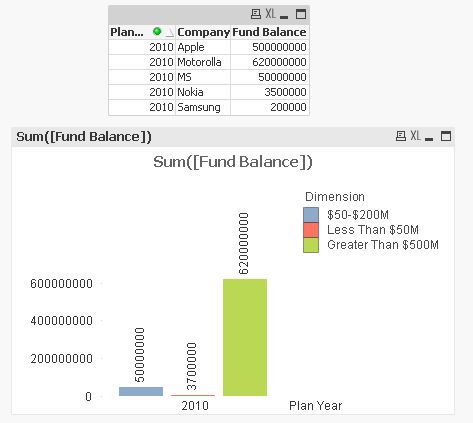
Please find the sample data below.
| Plan Year | Company | Fund Balance |
| 2010 | Apple | 500000000 |
| 2010 | MS | 50000000 |
| 2010 | Nokia | 3500000 |
| 2010 | Samsung | 200000 |
| 2010 | Motorolla | 620000000 |
| 2010 | Sony | 300000000 |
| 2011 | Motorolla | 500000000 |
| 2011 | Sony | 50000000 |
| 2011 | Samsung | 3500000 |
| 2011 | Nokia | 200000 |
| 2011 | Apple | 620000000 |
| 2011 | MS | 300000000 |
| 2012 | MS | 500000000 |
| 2012 | Apple | 50000000 |
| 2012 | Samsung | 3500000 |
| 2012 | Nokia | 200000 |
| 2012 | Sony | 620000000 |
| 2012 | Motorolla | 300000000 |
| 2013 | Apple | 500000000 |
| 2013 | MS | 50000000 |
| 2013 | Motorolla | 3500000 |
| 2013 | Sony | 200000 |
| 2013 | Samsung | 620000000 |
| 2013 | Nokia | 300000000 |
- Mark as New
- Bookmark
- Subscribe
- Mute
- Subscribe to RSS Feed
- Permalink
- Report Inappropriate Content
Looks okay?
- Mark as New
- Bookmark
- Subscribe
- Mute
- Subscribe to RSS Feed
- Permalink
- Report Inappropriate Content
Hi Anil,
Thanks for looking into this. But I am using QLIK Sense Not a Qlik View and I believe there is no much difference these two products. The attached bar chart of yours is not a Stacked BAR. Actually, I wanted to see % split of the buckets for each year. Can you please check my attached bar chart once?. Can that be achievable in QLIK?
Thanks,
-Vidya
- Mark as New
- Bookmark
- Subscribe
- Mute
- Subscribe to RSS Feed
- Permalink
- Report Inappropriate Content
Not this?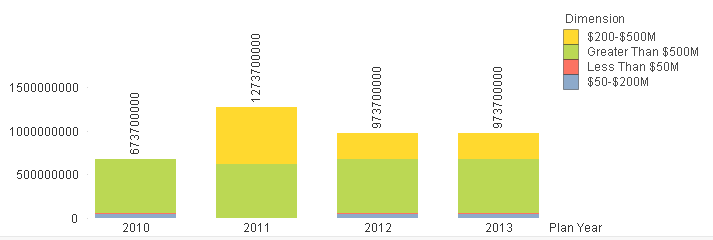
- Mark as New
- Bookmark
- Subscribe
- Mute
- Subscribe to RSS Feed
- Permalink
- Report Inappropriate Content
No Anil. When i convert this to 100% bar char i am getting 300% for every plan year. Acatully i want to split the dimensions for 100% per year
Example: For Plan Year 2013- 100% Stacked bar= 30% of '$200M-$500M', 20% of 'Greater than $500M', 40% of 'Less than $50M' and 10% of '%50M to $200M'
Thanks,
-Vidya
- Mark as New
- Bookmark
- Subscribe
- Mute
- Subscribe to RSS Feed
- Permalink
- Report Inappropriate Content
Do you enable the relative future? Can u share updated one
- Mark as New
- Bookmark
- Subscribe
- Mute
- Subscribe to RSS Feed
- Permalink
- Report Inappropriate Content
Yes. Anil I was able to fix that issue.
Resolution:
I created the Plan Size dimension in script editor using a resident table.
In Front End
Dimension 1: PLAN YEAR
Dimension 2: PLANSIZE (This dimension I have created in Script editor as I mentioned)
Measure Expression: sum(FUNDBALANCE) / sum(total <PLANYEAR> FUNDBALANCE)
Result:
Thanks,
-Vidya
- Mark as New
- Bookmark
- Subscribe
- Mute
- Subscribe to RSS Feed
- Permalink
- Report Inappropriate Content
Thats great, if you feel to mark helpful others. That would be dispense more information