Unlock a world of possibilities! Login now and discover the exclusive benefits awaiting you.
- Qlik Community
- :
- All Forums
- :
- QlikView App Dev
- :
- Data historization
- Subscribe to RSS Feed
- Mark Topic as New
- Mark Topic as Read
- Float this Topic for Current User
- Bookmark
- Subscribe
- Mute
- Printer Friendly Page
- Mark as New
- Bookmark
- Subscribe
- Mute
- Subscribe to RSS Feed
- Permalink
- Report Inappropriate Content
Data historization
Hi there,
I have been looking for a solution to this problem for a long time, and I didn't find anything interesting yet, maybe someone here could give me some hints:
What I am trying to do is to store the data of my tables once a month (or more frequently, like once a day.), and be able to retrieve those data on demand through a web application, to put together two tables about two different periods and compare the results, stuff like that. The problem is that I can no longer calculate the data in my arrays after a certain period (say a month) because it would give wrong values.That's why I looking for an historization feature.
What I need is to consolidate the values of the arrays of my application, put them into the data model, and to be able to retrieve them afterwards, to sum the values if I want to work on a longer period than a month, stuff like that.
Is there any efficient method to do so, appart from calculate everything through the script and store directly every values in the data model? I'd like to use the formulaes that I have built for my graphs so far (there are loads of them).
Thank you in advance for your answers, any help is appreciated. 
Julian
- Tags:
- new_to_qlikview
- Mark as New
- Bookmark
- Subscribe
- Mute
- Subscribe to RSS Feed
- Permalink
- Report Inappropriate Content
Hi,
Can you please describe us what you want to do, with an example.
Regards,
Kaushik Solanki
- Mark as New
- Bookmark
- Subscribe
- Mute
- Subscribe to RSS Feed
- Permalink
- Report Inappropriate Content
Hi Kaushik, thank you for your answer.
Unfortunately I won't be allowed to provide my application, but I can provide a good example of what I'd like to do:
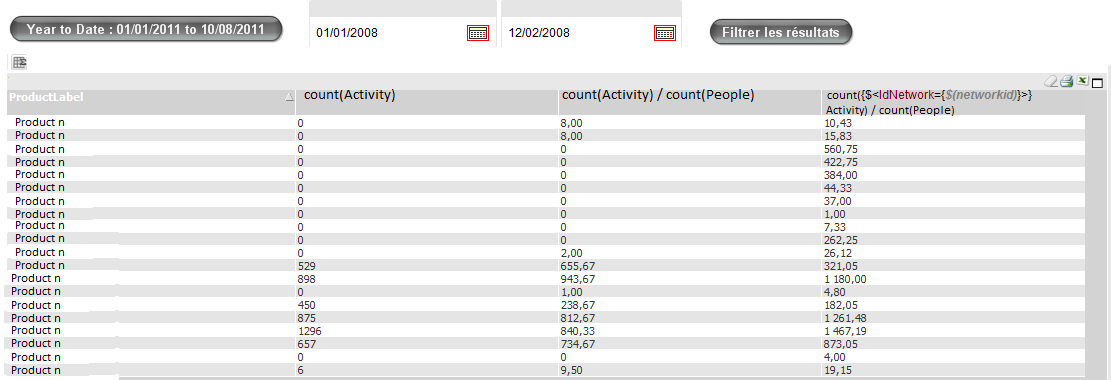
In this example for instance, the result of count(People) might vary frequently. We don't want the previous results to be affected by that. Therefore, we need to store the results of theses tables at the end of each month, and to be able to use their values afterwards. Since I have a lot of tables, it would be really time-consuming to rebuild my whole application through the script, and I am under the impression that I would lose the real benefit of Qlikview by doing so.
Is there any solution to export the result of the array I put as an example, and to store its values "somewhere" and to be able to play with these values as I described in my previous post?
Thank you,
Julian
- Mark as New
- Bookmark
- Subscribe
- Mute
- Subscribe to RSS Feed
- Permalink
- Report Inappropriate Content
Hi,
Let me tell you what i understood, correct me if I am wrong.
As you shown in pic, that the chart contains some calculation for one month. Every month you store this into some file. And in next month you want to show this records too...
So you are wondering how can you achieve this.
Regards,
Kaushik Solanki
- Mark as New
- Bookmark
- Subscribe
- Mute
- Subscribe to RSS Feed
- Permalink
- Report Inappropriate Content
That is correct. But I don't necessarily want to display only the previous month, it can also be the previous year (so I'd have to re-use the previous 12 calculations I have stored)
- Mark as New
- Bookmark
- Subscribe
- Mute
- Subscribe to RSS Feed
- Permalink
- Report Inappropriate Content
Hi,
one more thing. you create the above table only for a single month..?
Can you please tell me how actually your data is and what you are trying to display in application.
Regards,
Kaushik Solanki
- Mark as New
- Bookmark
- Subscribe
- Mute
- Subscribe to RSS Feed
- Permalink
- Report Inappropriate Content
Hi Kaushik,
I create the above table for an undefined period (As you can see on the picture, the user can select the period that needs to be displayed. If we were to store the results each month, we would of course only allow to choose the "month/year" rather than the "day/month/year".
Our tables contain products and related data, such as what amount of product has been sold for each product, how many people were working on these sales, what is the average number of products sold by team, etc. In the above table, an activity represents a product, the persons represent the members of the sales teams. If the last month, my sales team had 10 salers, and today is only has 8 salers, the average number of product sold will be wrong for all previous periods.
Please, tell me if you need any further explanation.
Regards,
Julian
- Mark as New
- Bookmark
- Subscribe
- Mute
- Subscribe to RSS Feed
- Permalink
- Report Inappropriate Content
HI,
This problem is related to slowly changing dimension. So please give me some time. I will soon get back to you with some solution to this problem.
Regards,
Kaushik Solanki
- Mark as New
- Bookmark
- Subscribe
- Mute
- Subscribe to RSS Feed
- Permalink
- Report Inappropriate Content
Many thanks, that would be of a great help for me