Unlock a world of possibilities! Login now and discover the exclusive benefits awaiting you.
- Qlik Community
- :
- All Forums
- :
- QlikView App Dev
- :
- Re: Sort by Calculated Expression?
- Subscribe to RSS Feed
- Mark Topic as New
- Mark Topic as Read
- Float this Topic for Current User
- Bookmark
- Subscribe
- Mute
- Printer Friendly Page
- Mark as New
- Bookmark
- Subscribe
- Mute
- Subscribe to RSS Feed
- Permalink
- Report Inappropriate Content
Sort by Calculated Expression?
Hi,
Hoping for some guidance.....
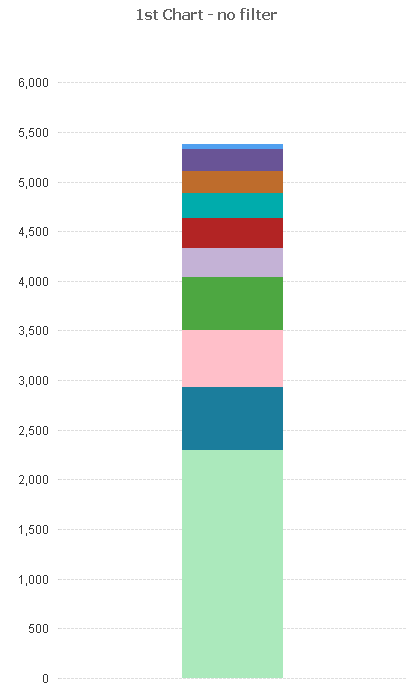
I have a set of bar charts that each show a stacked bar that contains a set of defined expressions.
eg: Count({<[4th Place]={'All Things'}>}([4thThere]))
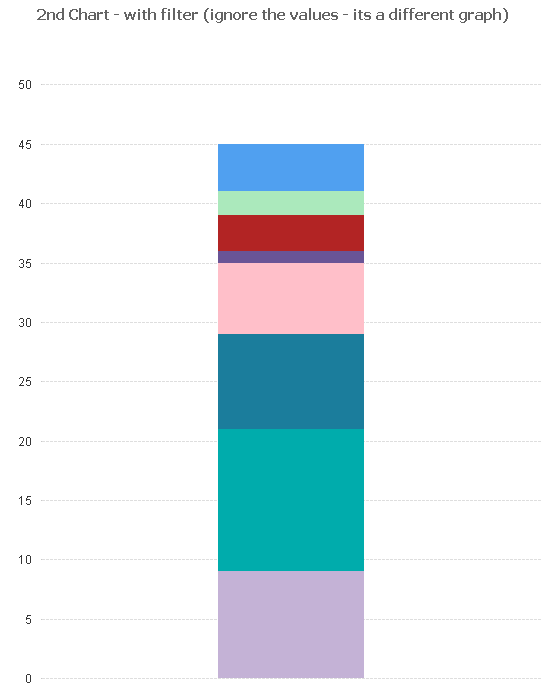
What I would like to happen is for when I select a defined element (eg Month) that it alters the order of the chart so that the largest numbered section is at the bottom. At the moment it retains everything in the order that is shown in the 'Expressions' Tab.
Any ideas?
- Mark as New
- Bookmark
- Subscribe
- Mute
- Subscribe to RSS Feed
- Permalink
- Report Inappropriate Content
Maybe you can create a fake dimension with Valuelist() and have only one expression.
So you can use that expression under Sort tab
- Mark as New
- Bookmark
- Subscribe
- Mute
- Subscribe to RSS Feed
- Permalink
- Report Inappropriate Content
Would you be able to share a sample to try this out?
- Mark as New
- Bookmark
- Subscribe
- Mute
- Subscribe to RSS Feed
- Permalink
- Report Inappropriate Content
Sorry, I'm not quite sure how I would do that.
Could you explain a little bit for me?
- Mark as New
- Bookmark
- Subscribe
- Mute
- Subscribe to RSS Feed
- Permalink
- Report Inappropriate Content
Add ValueList('Exp1','Exp2') as dimension
Create one expression like
If(Valuelist('Exp1','Exp2') = 'Exp1',
Sum(Expression1),
If(Valuelist('Exp1','Exp2') = 'Exp2',
Sum(Expression2)
))
- Mark as New
- Bookmark
- Subscribe
- Mute
- Subscribe to RSS Feed
- Permalink
- Report Inappropriate Content
Attached is a small example of the data.
1st Graph:
Used Dimensions: 1stPlace
Expression 'General' - Count({<[1st Place Speciality]={'General'}>}([1stPlace]))
2nd Graph:
Used Dimensions: 2ndPlace
Expression 'General' - Count({<[2nd Place Speciality]={'General'}>}([2ndPlace]))
and then theres obviously lots of other expressions showing the other elements.
- Mark as New
- Bookmark
- Subscribe
- Mute
- Subscribe to RSS Feed
- Permalink
- Report Inappropriate Content
Sorry, I'm obviously having a slow day.
I don't understand how that would work.