Unlock a world of possibilities! Login now and discover the exclusive benefits awaiting you.
- Qlik Community
- :
- All Forums
- :
- QlikView App Dev
- :
- Re: Ignore filter on X axis for cumulative graph
- Subscribe to RSS Feed
- Mark Topic as New
- Mark Topic as Read
- Float this Topic for Current User
- Bookmark
- Subscribe
- Mute
- Printer Friendly Page
- Mark as New
- Bookmark
- Subscribe
- Mute
- Subscribe to RSS Feed
- Permalink
- Report Inappropriate Content
Ignore filter on X axis for cumulative graph
Hello Qlick community,
I need your help concerning my problem.
I am using Qlik sense.
I have 2 tables, a table which is my calendar reference and containing first day of each month. A second table containing 3 fields: KEY, CREATION DATE.
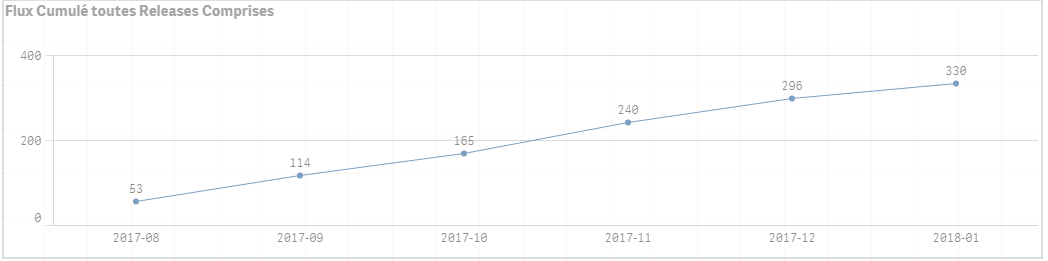
I have created a cumulative graph to have the sum off all created KEY each month:
DIM: = [Reference Date.autoCalendar.Year] & '-' & [Reference Date.autoCalendar.Month]
MESURE: = RangeSum(Above(COUNT(Distinct if([Reference Date.autoCalendar.YearMonth]=[CREATION DATE.autoCalendar.YearMonth] ,[KEY] )),0,RowNo(TOTAL)))
I obtain the bellow graph which so far OK:
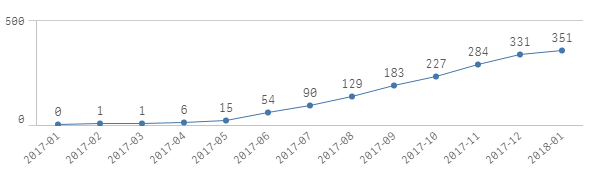
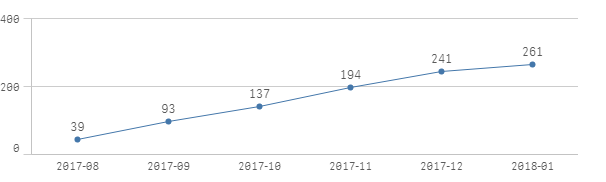
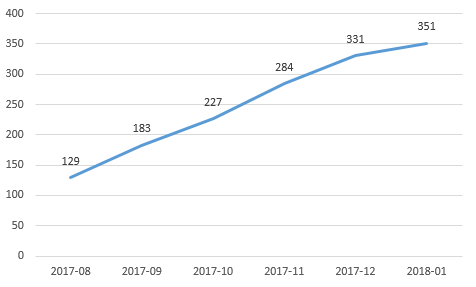
My problem is the following, I want to limit the number of month I display to 6 months, I tried to filter the result in dimension, or using filter but it does not work, it ignore all entries before the 6 last months and the graph I obtain is the follow, so I losing 90 KEYs.
Thanks in advance.
Accepted Solutions
- Mark as New
- Bookmark
- Subscribe
- Mute
- Subscribe to RSS Feed
- Permalink
- Report Inappropriate Content
You always want to see last 6 months from today? Try this
RangeSum(
Above(
COUNT(Distinct
{<[Date Réference]>} if([Date Réference.autoCalendar.YearMonth]=[DATE CRÉATION.autoCalendar.YearMonth] ,[KEY] ))
,0,RowNo(TOTAL)))* Avg({<[Date Réference] = {"$(='>=' & Date(MonthStart(Today(), -5)) & '<=' & Date(Today()))"}>} 1)
- Mark as New
- Bookmark
- Subscribe
- Mute
- Subscribe to RSS Feed
- Permalink
- Report Inappropriate Content
Hi HAJ, one way to show cummulative months is using an AsOf calendar:
The bad thing is that it uses another field as dimensions but allows for a lot easier expressions.
- Mark as New
- Bookmark
- Subscribe
- Mute
- Subscribe to RSS Feed
- Permalink
- Report Inappropriate Content
If you need expression only solution, you can try this
=RangeSum(Above(Count(DISTINCT {<Date>} If([Reference Date.autoCalendar.YearMonth]=[CREATION DATE.autoCalendar.YearMonth] ,[KEY] )),0,RowNo(TOTAL))) * Avg({<Date = {"$(='>=' & Date(MonthStart(Max(Date), -5)) & '<=' & Date(Max(Date)))"}>} 1)
- Mark as New
- Bookmark
- Subscribe
- Mute
- Subscribe to RSS Feed
- Permalink
- Report Inappropriate Content
Hello,
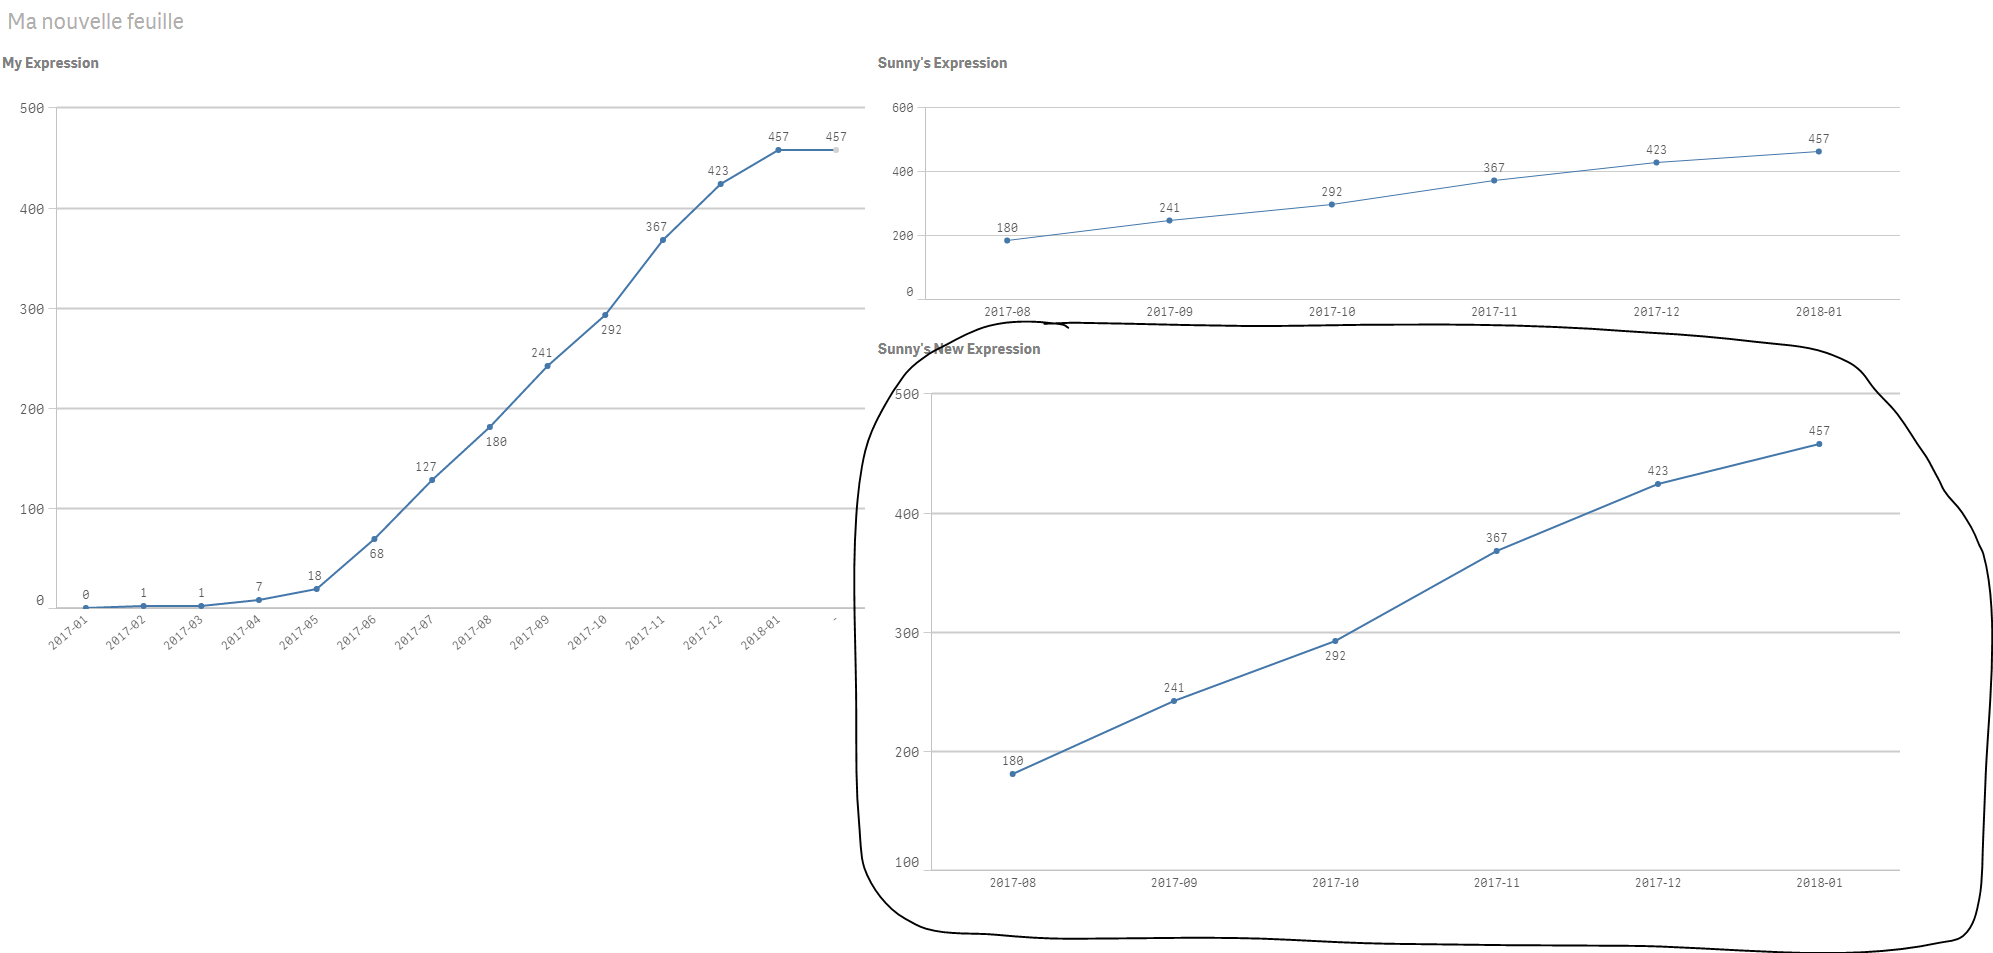
stalwar1 unfortunately your proposition does not work, by default it add more record to the original results, and by filtering only on the last 6 months I still don't have the correct result. By I really want to resole the issue by expression. Screen shots bellow.
rubenmarin I appreciate your solution, but I have already multiple dimensions to work with and using the AS-OF table will add more complexity.
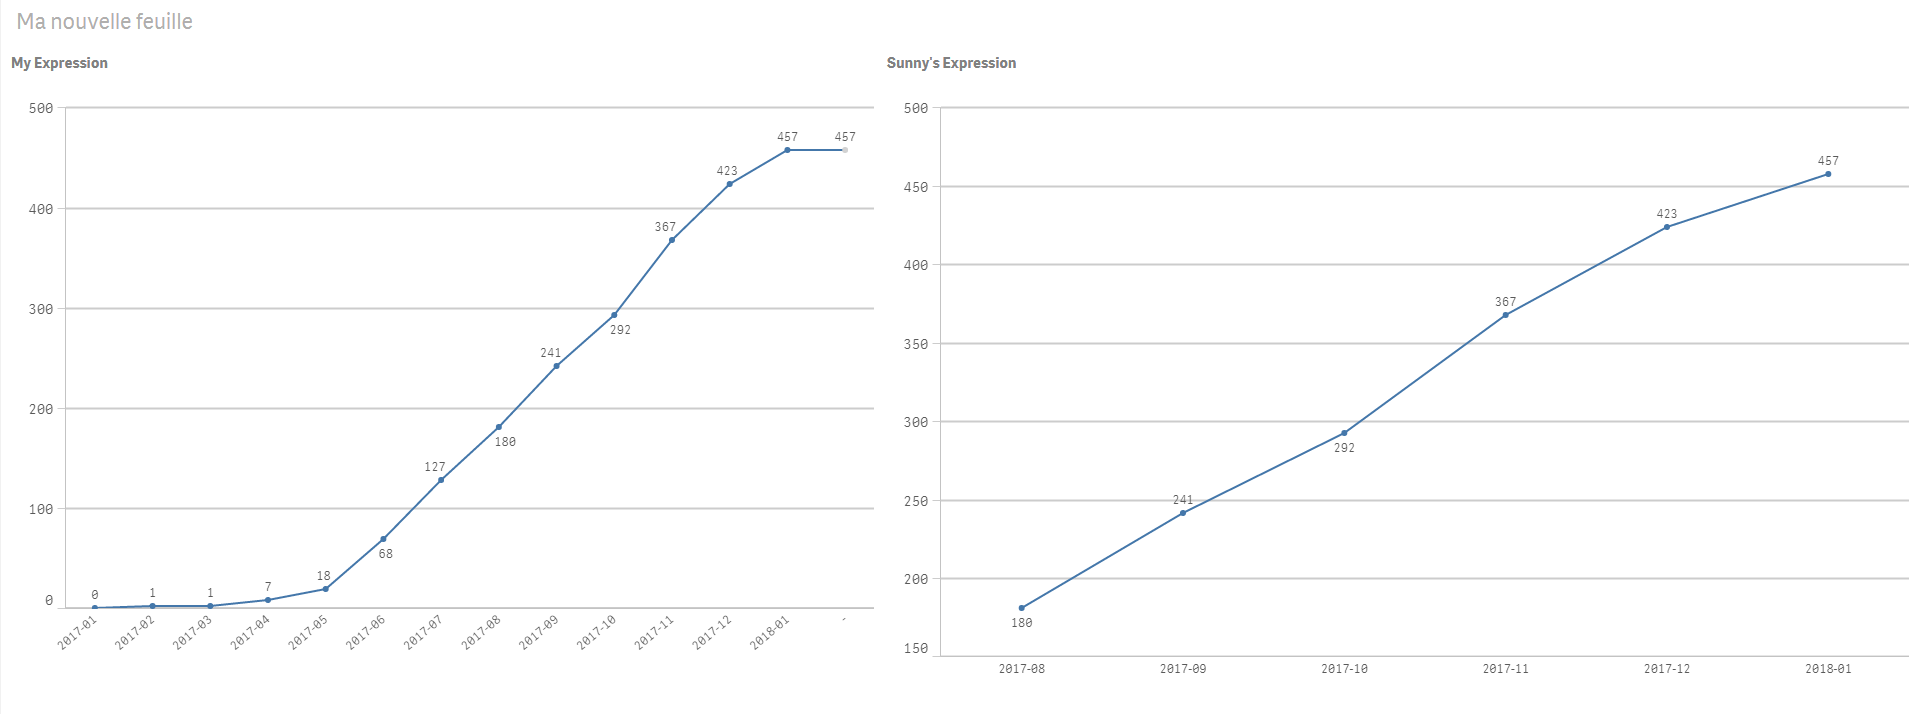
Graph after Sunny's formula:
What I want to see:
Other ideas guys?
- Mark as New
- Bookmark
- Subscribe
- Mute
- Subscribe to RSS Feed
- Permalink
- Report Inappropriate Content
The image you got above using the expression i gave, was this after or before making selections? Would you be able to share your qvf to check it out?
- Mark as New
- Bookmark
- Subscribe
- Mute
- Subscribe to RSS Feed
- Permalink
- Report Inappropriate Content
Hello Sunny,
Please find attached the .qvf. Data are a little bit different, it a test qvf.
The graph I posted was after the selection of last 6 months.
Thanks for your help.
- Mark as New
- Bookmark
- Subscribe
- Mute
- Subscribe to RSS Feed
- Permalink
- Report Inappropriate Content
You always want to see last 6 months from today? Try this
RangeSum(
Above(
COUNT(Distinct
{<[Date Réference]>} if([Date Réference.autoCalendar.YearMonth]=[DATE CRÉATION.autoCalendar.YearMonth] ,[KEY] ))
,0,RowNo(TOTAL)))* Avg({<[Date Réference] = {"$(='>=' & Date(MonthStart(Today(), -5)) & '<=' & Date(Today()))"}>} 1)
- Mark as New
- Bookmark
- Subscribe
- Mute
- Subscribe to RSS Feed
- Permalink
- Report Inappropriate Content
Thanks a lot for your help!
As extra solution, do you how I can get the same result but by filtering at what ever date segments ?
- Mark as New
- Bookmark
- Subscribe
- Mute
- Subscribe to RSS Feed
- Permalink
- Report Inappropriate Content
Try this
RangeSum(
Above(
COUNT(Distinct
{<[Date Réference]>} if([Date Réference.autoCalendar.YearMonth]=[DATE CRÉATION.autoCalendar.YearMonth] ,[KEY] ))
,0,RowNo(TOTAL)))* Avg({<[Date Réference] = {"$(='>=' & Date(MonthStart(Max({<[Date Réference] = {'<=$(=Date(Today()))'}>}[Date Réference]), -5)) & '<=' & Date(Max({<[Date Réference] = {'<=$(=Date(Today()))'}>}[Date Réference])))"}>} 1)