Unlock a world of possibilities! Login now and discover the exclusive benefits awaiting you.
- Qlik Community
- :
- All Forums
- :
- QlikView App Dev
- :
- Re: how to bring data seperately?
- Subscribe to RSS Feed
- Mark Topic as New
- Mark Topic as Read
- Float this Topic for Current User
- Bookmark
- Subscribe
- Mute
- Printer Friendly Page
- Mark as New
- Bookmark
- Subscribe
- Mute
- Subscribe to RSS Feed
- Permalink
- Report Inappropriate Content
how to bring data seperately?
I have a straight table and a list box. Data in the straight table is displayed according to the filter in the list box. Below is a snapshot.
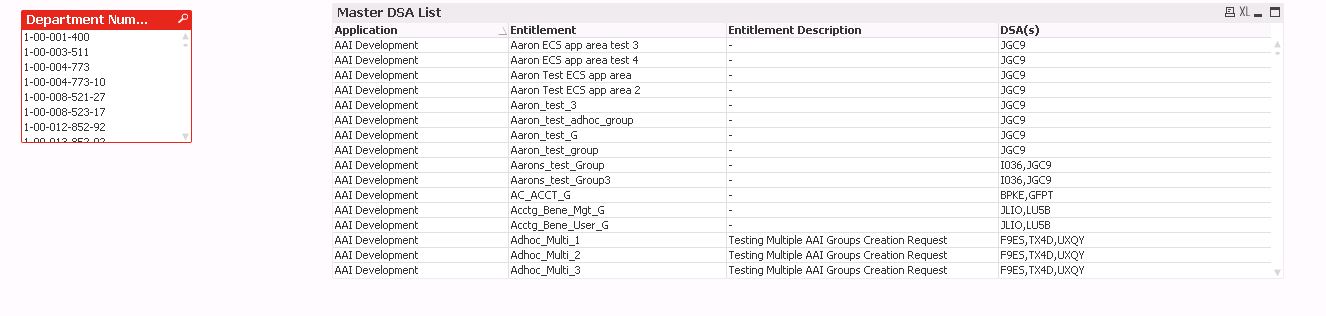 As you can see in the Master DSA List straight table, I have multiple DSAs in the same row.
This is my script to bring in the DSA.
TextBetween(Replace(Replace(Replace(Replace(ATTRIBUTES, chr(10), ''), ' ', ''), '<String>', ''), '</String>', ','), '<entrykey="SFGROUPOWNER"><value><List>', '</List>') As MAGroupOwners,
MAGroupOwners is renamed as DSA.
What can I do in the script to bring each MAGroupOwners separately in each row? Also, how can I do the same thing in the straight chart? I would really appreciate the help.
Accepted Solutions
- Mark as New
- Bookmark
- Subscribe
- Mute
- Subscribe to RSS Feed
- Permalink
- Report Inappropriate Content
This will create one record per DSA:
LOAD
Application,
Entitlement,
[Entitlement Description],
SubField([DSA(s)], ',') As DSA
FROM ...
- Mark as New
- Bookmark
- Subscribe
- Mute
- Subscribe to RSS Feed
- Permalink
- Report Inappropriate Content
This will create one record per DSA:
LOAD
Application,
Entitlement,
[Entitlement Description],
SubField([DSA(s)], ',') As DSA
FROM ...
- Mark as New
- Bookmark
- Subscribe
- Mute
- Subscribe to RSS Feed
- Permalink
- Report Inappropriate Content
You mean you want those comma separated values as separate rows? Eg. JLIO, LU5B? May be use
Subfield() Function around your textybetween like
Subfield(textbetween(Replace....)), ',')) AS MAGroupOwners
- Mark as New
- Bookmark
- Subscribe
- Mute
- Subscribe to RSS Feed
- Permalink
- Report Inappropriate Content
Thanks Jonathan.