Unlock a world of possibilities! Login now and discover the exclusive benefits awaiting you.
- Qlik Community
- :
- All Forums
- :
- QlikView App Dev
- :
- Re: Chart function
- Subscribe to RSS Feed
- Mark Topic as New
- Mark Topic as Read
- Float this Topic for Current User
- Bookmark
- Subscribe
- Mute
- Printer Friendly Page
- Mark as New
- Bookmark
- Subscribe
- Mute
- Subscribe to RSS Feed
- Permalink
- Report Inappropriate Content
Chart function
Hi all i have problem in chart calculation
for 1st row of calculation i.e., for date 28/12/18 which is a dummy record joined with the fact table so for
each fund(a,b,c....) the 28/12/17 were added, for all funds with 28/12/17 as 1st row and calcualtion i need is (Qty/nv)*Rate and
from 2nd row and above (above of calulation field) /(1+Coresponding level field values)
ex:
Date Qty/Nv level Rate Value(Calculation)
28/12/18 11.2 3 11.2*3=33.6 (only for 1st row i.e., for date 28/12/18 calculation (Oty/nv)*Rate)
27/12/18 22.2 40 4 33.6/(1+40)=0.81 from 2nd and above the calculation is (Above(Value)/(1+coresponding level)
26/12/18 32 50 6 0.81/(1+50)=0.66 continue as above..........
..... 60
...
..
'Value' field is an expected output
- « Previous Replies
- Next Replies »
- Mark as New
- Bookmark
- Subscribe
- Mute
- Subscribe to RSS Feed
- Permalink
- Report Inappropriate Content
Thanks alot Sunny and Anil,its working
but last changes i need ,After Calculation ,i wanna hide values for date 28/12/17, the entir row should b hideded
- Mark as New
- Bookmark
- Subscribe
- Mute
- Subscribe to RSS Feed
- Permalink
- Report Inappropriate Content
I've update from Sunny example. May be look attached
- Mark as New
- Bookmark
- Subscribe
- Mute
- Subscribe to RSS Feed
- Permalink
- Report Inappropriate Content
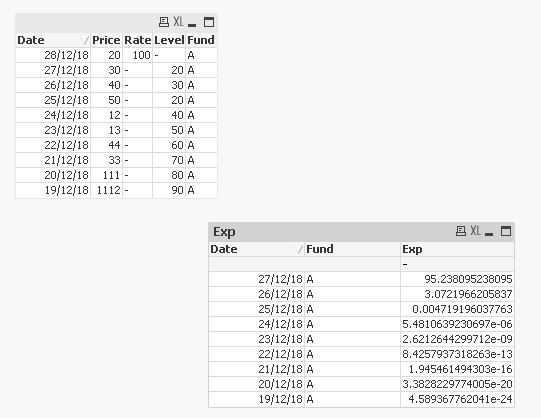
Try this expression
=If(RowNo(TOTAL) = 2, Above(TOTAL Rate*Price)/(1+Level), Above(TOTAL Exp)/(1+Level))
- Mark as New
- Bookmark
- Subscribe
- Mute
- Subscribe to RSS Feed
- Permalink
- Report Inappropriate Content
Thanks a lot  ,its working
- « Previous Replies
- Next Replies »