Unlock a world of possibilities! Login now and discover the exclusive benefits awaiting you.
- Qlik Community
- :
- Forums
- :
- Analytics
- :
- New to Qlik Analytics
- :
- Re: How can I make font or chart colour conditiona...
- Subscribe to RSS Feed
- Mark Topic as New
- Mark Topic as Read
- Float this Topic for Current User
- Bookmark
- Subscribe
- Mute
- Printer Friendly Page
- Mark as New
- Bookmark
- Subscribe
- Mute
- Subscribe to RSS Feed
- Permalink
- Report Inappropriate Content
How can I make font or chart colour conditional in Qlik Sense?
Hello,
Is there any way to make the colour of the font in a text chart (or even better the background colour itself) change in accordance with the calculation?
For example, if the expression delivers a minus amount I would like this to show in RED, if the expression delivers a plus amount I would like this in GREEN.
I have found calculation for QLIK View but it does not work, it just replaces the calculation with words RED or GREEN. Below if the calculation I tried on a text chart.
if((Sum({$<[Requisition Status]={Closed}>}[Number of Filled Reqs])-1)>0,'Green','Red')
Thanks,
Kizzy
- « Previous Replies
-
- 1
- 2
- Next Replies »
- Mark as New
- Bookmark
- Subscribe
- Mute
- Subscribe to RSS Feed
- Permalink
- Report Inappropriate Content
Hi Rob,
Thanks for the information but I am trying to do this on a text chart and it does not have the same options as a bar chart.
Thanks,
Kizzy
- Mark as New
- Bookmark
- Subscribe
- Mute
- Subscribe to RSS Feed
- Permalink
- Report Inappropriate Content
Hi Peter,
Thanks for the tip, I have now moved the question over.
Thanks,
Kizzy
- Mark as New
- Bookmark
- Subscribe
- Mute
- Subscribe to RSS Feed
- Permalink
- Report Inappropriate Content
Kizzy,
The example I posted was from a text chart. Perhaps you are using an older version? What version are you using?
-Rob
- Mark as New
- Bookmark
- Subscribe
- Mute
- Subscribe to RSS Feed
- Permalink
- Report Inappropriate Content
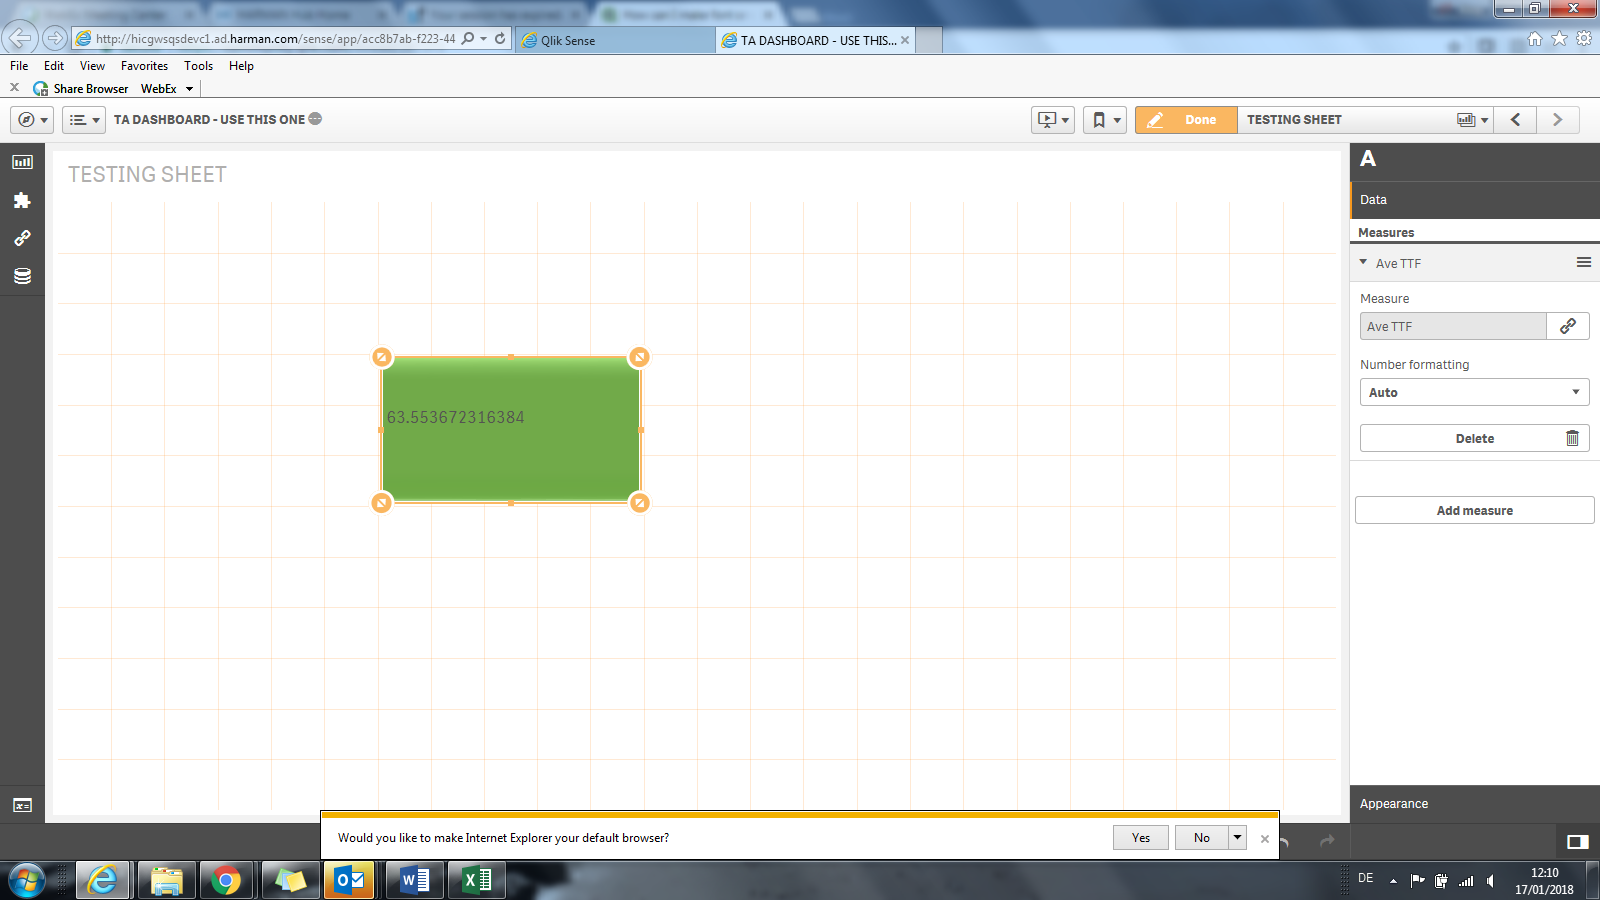
Hi Rob,
The example I see is for a table chart with columns.
Here is the chart I am using with my data options.
Thanks,
Kizzy
- Mark as New
- Bookmark
- Subscribe
- Mute
- Subscribe to RSS Feed
- Permalink
- Report Inappropriate Content
I see, I misunderstood. You are using a "Text & Image" object which does not provide for conditional colors. You might try switching to a KPI object which does provide conditional color.
-Rob
- Mark as New
- Bookmark
- Subscribe
- Mute
- Subscribe to RSS Feed
- Permalink
- Report Inappropriate Content
Hi Rob,
This works perfectly, thanks for your help 
Kizzy
- « Previous Replies
-
- 1
- 2
- Next Replies »